Advertisement
- United States
- /
- Specialty Stores
- /
- NYSE:ANF
Has Abercrombie & Fitch’s 261% Three-Year Rally Created an Opportunity in 2025?

Simply Wall St
Reviewed by Bailey Pemberton
- Curious if Abercrombie & Fitch is truly a bargain or just riding a wave? Let’s break down what’s going on with its shares and see if an opportunity is hiding in plain sight.
- The stock has swung from a sharp -54.5% loss year-to-date to an impressive 261.1% gain over the past three years. This performance catches the eye of both optimists and skeptics.
- Recent headlines highlight shifting consumer trends and renewed brand interest as catalysts behind the recent price moves. For instance, Abercrombie’s strategy of tapping into nostalgia with updated styles and a growing Gen Z fan base is making waves in both financial and fashion news.
- So, is Abercrombie’s valuation justified? Its value score is 5 out of 6. However, understanding its true worth means looking beyond the numbers. Stay tuned for a deeper dive into valuation methods and an even better way to judge if the stock is fairly priced.
Find out why Abercrombie & Fitch's -50.2% return over the last year is lagging behind its peers.
Approach 1: Abercrombie & Fitch Discounted Cash Flow (DCF) Analysis
A Discounted Cash Flow (DCF) model estimates a company's true value by projecting its future cash flows and then discounting them back to today’s dollars. This helps investors judge whether a stock is a bargain or overpriced using expected performance, rather than just current headlines.
For Abercrombie & Fitch, the most recent reported Free Cash Flow (FCF) stands at $352.9 million. Analysts provide direct estimates up to five years, showing FCF peaking at $523 million and then declining to $312 million by 2028. Beyond that, cash flows are extrapolated and suggest a gradual recovery to $340.7 million by 2035. All projections are calculated in U.S. dollars, consistent with Abercrombie's reporting.
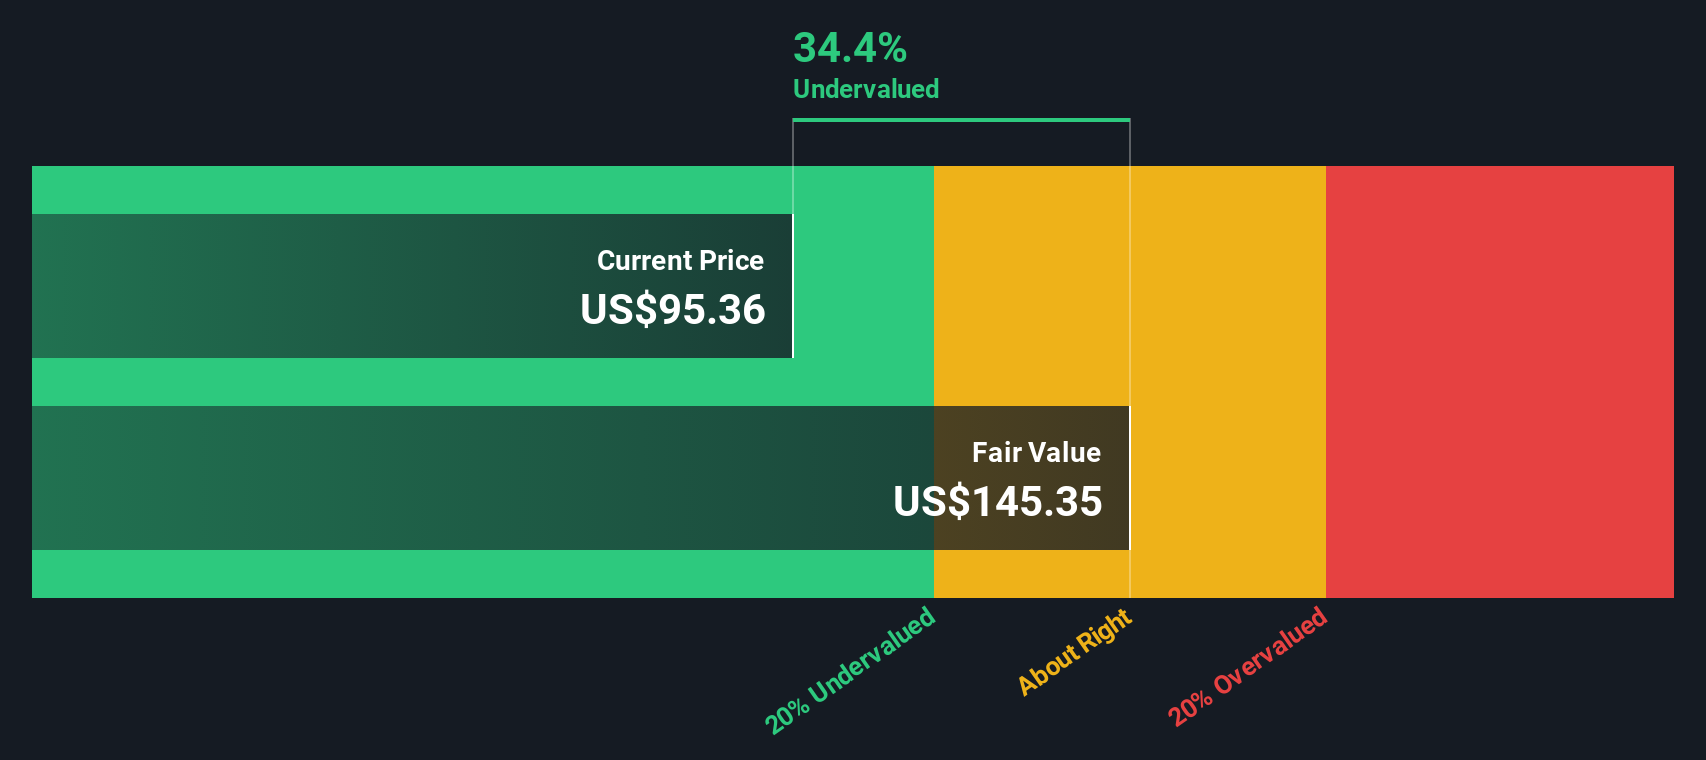
Taking these projections and discounting them back to today gives an estimated intrinsic value of $103.66 per share. Compared to the current market price, this value reflects a 32.8% discount, indicating shares are significantly undervalued according to this model.
Result: UNDERVALUED
Our Discounted Cash Flow (DCF) analysis suggests Abercrombie & Fitch is undervalued by 32.8%. Track this in your watchlist or portfolio, or discover 857 more undervalued stocks based on cash flows.
Approach 2: Abercrombie & Fitch Price vs Earnings
The Price-to-Earnings (PE) ratio is the preferred valuation metric for companies like Abercrombie & Fitch that are profitable and consistently generate positive earnings. This ratio helps investors judge how much they are paying for each dollar of earnings and is especially helpful for established, profit-making businesses.
A “normal” or “fair” PE ratio depends on several factors, including how fast a company's earnings are expected to grow, the risks involved, and what the market is willing to pay for similar companies. Higher growth and lower risk typically support higher PE ratios. Lower growth or riskier business models usually result in lower PE multiples.
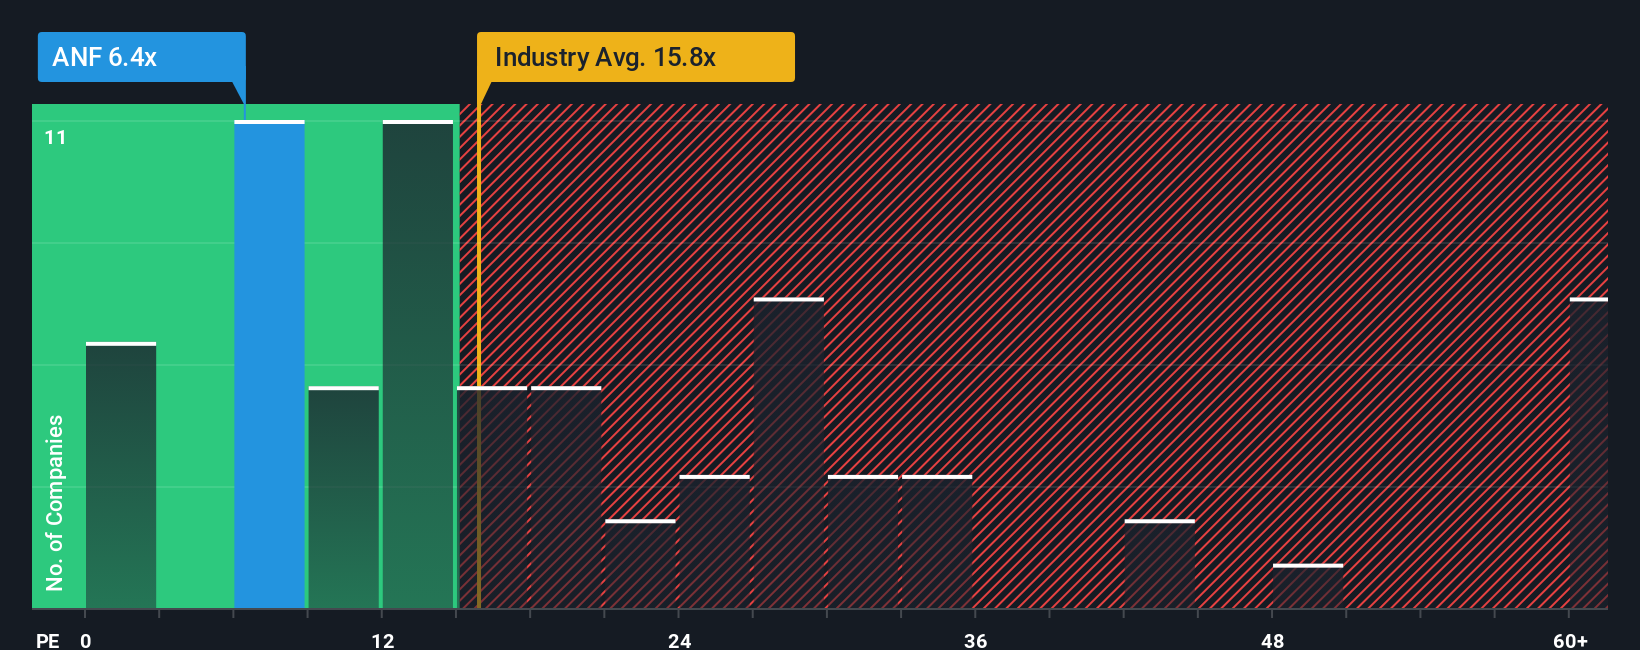
Currently, Abercrombie & Fitch trades at a PE ratio of 6.1x. This is well below the specialty retail industry average of 18.3x and the peer average of 18.7x. However, Simply Wall St’s proprietary “Fair Ratio” model suggests a fair PE of 14.5x for Abercrombie, based on factors like its earnings growth outlook, profit margins, market cap, and risk profile.
The Fair Ratio is more informative than a simple comparison to peers or industry averages. It uniquely adjusts for the nuances of Abercrombie’s specific financials, business environment, and growth trajectory, providing a tailored benchmark for fair value.
Since Abercrombie's actual PE of 6.1x is well below its Fair Ratio of 14.5x, the data suggests the stock is undervalued based on earnings multiples.
Result: UNDERVALUED
PE ratios tell one story, but what if the real opportunity lies elsewhere? Discover 1367 companies where insiders are betting big on explosive growth.
Upgrade Your Decision Making: Choose your Abercrombie & Fitch Narrative
Earlier we mentioned that there’s an even better way to understand valuation, so let's introduce you to Narratives. A Narrative is more than just a number; it’s your personalized story about a company's future, where you lay out your view on where Abercrombie & Fitch is headed and the key events or trends you believe will shape those results. Narratives connect what you see in the company, such as new partnerships, brand turnarounds, or industry headwinds, with your own estimates for future revenue, earnings, and profit margins. That story then flows through to a fair value and a clear conviction for buying, holding, or selling based on how today's market price compares.
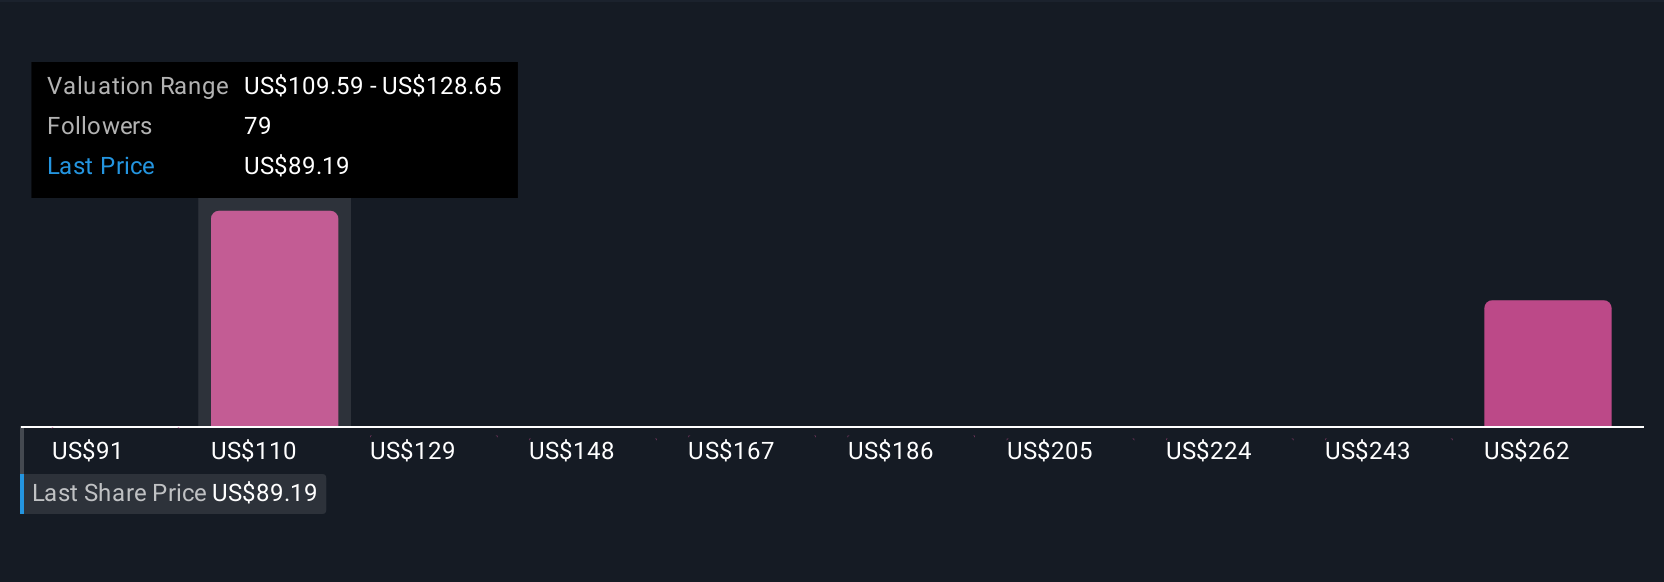
This approach is easy and accessible. Simply Wall St’s millions-strong Community uses Narratives on every company page, letting you update your view whenever new information, such as earnings or news, emerges. Narratives empower you to make better, faster decisions. For example, some Abercrombie & Fitch investors believe international growth and strong digital sales justify a bullish price target of $145, while others worry about persistent tariff headwinds and forecast just $84. This diversity of perspectives, all dynamically tracked as fresh data arrives, means you never have to invest blindly or rely solely on static ratios.
Do you think there's more to the story for Abercrombie & Fitch? Head over to our Community to see what others are saying!
This article by Simply Wall St is general in nature. We provide commentary based on historical data and analyst forecasts only using an unbiased methodology and our articles are not intended to be financial advice. It does not constitute a recommendation to buy or sell any stock, and does not take account of your objectives, or your financial situation. We aim to bring you long-term focused analysis driven by fundamental data. Note that our analysis may not factor in the latest price-sensitive company announcements or qualitative material. Simply Wall St has no position in any stocks mentioned.
New: Manage All Your Stock Portfolios in One Place
We've created the ultimate portfolio companion for stock investors, and it's free.
• Connect an unlimited number of Portfolios and see your total in one currency
• Be alerted to new Warning Signs or Risks via email or mobile
• Track the Fair Value of your stocks
Have feedback on this article? Concerned about the content? Get in touch with us directly. Alternatively, email editorial-team@simplywallst.com
About NYSE:ANF
Abercrombie & Fitch
Through its subsidiaries, operates as an omnichannel retailer in the Americas, Europe, the Middle East, Africa, and the Asia-Pacific.
Flawless balance sheet and undervalued.
Similar Companies
Market Insights

Advertisement
Community Narratives
MINISO's fair value is projected at 26.69 with an anticipated PE ratio shift of 20x
Fair Value US$24.03|9.6% undervalued
BE
Community Contributor
Procter & Gamble: A Dividend Giant Facing Slowing Growth
Fair Value US$119.81|24.0% overvalued
AN
Community Contributor
Eli Lilly's Future Growth Driven by Tirzepatide and Favorable Market Conditions
Fair Value US$1.19k|14.4% undervalued
EA
Community Contributor