
Advertisement
- United States
- /
- Specialty Stores
- /
- NasdaqGS:TDUP
ThredUp Inc. (NASDAQ:TDUP) Stocks Shoot Up 30% But Its P/S Still Looks Reasonable
ThredUp Inc. (NASDAQ:TDUP) shareholders would be excited to see that the share price has had a great month, posting a 30% gain and recovering from prior weakness. But the gains over the last month weren't enough to make shareholders whole, as the share price is still down 5.0% in the last twelve months.
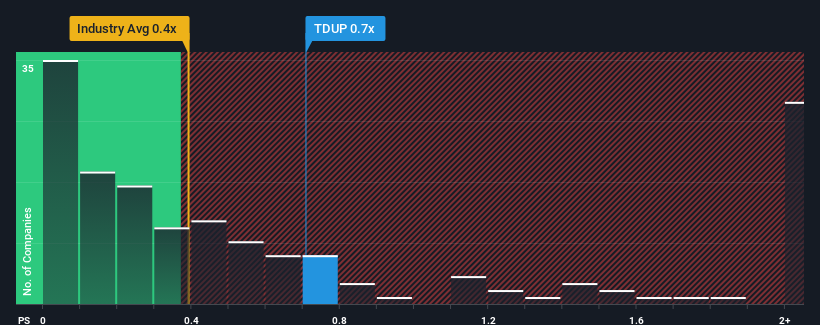
Even after such a large jump in price, it's still not a stretch to say that ThredUp's price-to-sales (or "P/S") ratio of 0.7x right now seems quite "middle-of-the-road" compared to the Specialty Retail industry in the United States, where the median P/S ratio is around 0.4x. While this might not raise any eyebrows, if the P/S ratio is not justified investors could be missing out on a potential opportunity or ignoring looming disappointment.
Check out our latest analysis for ThredUp
How ThredUp Has Been Performing
ThredUp certainly has been doing a good job lately as it's been growing revenue more than most other companies. Perhaps the market is expecting this level of performance to taper off, keeping the P/S from soaring. If not, then existing shareholders have reason to be feeling optimistic about the future direction of the share price.
Keen to find out how analysts think ThredUp's future stacks up against the industry? In that case, our free report is a great place to start.What Are Revenue Growth Metrics Telling Us About The P/S?
ThredUp's P/S ratio would be typical for a company that's only expected to deliver moderate growth, and importantly, perform in line with the industry.
If we review the last year of revenue growth, the company posted a worthy increase of 12%. Pleasingly, revenue has also lifted 68% in aggregate from three years ago, partly thanks to the last 12 months of growth. Accordingly, shareholders would have definitely welcomed those medium-term rates of revenue growth.
Looking ahead now, revenue is anticipated to climb by 3.7% during the coming year according to the six analysts following the company. With the industry predicted to deliver 3.7% growth , the company is positioned for a comparable revenue result.
In light of this, it's understandable that ThredUp's P/S sits in line with the majority of other companies. Apparently shareholders are comfortable to simply hold on while the company is keeping a low profile.
The Final Word
ThredUp's stock has a lot of momentum behind it lately, which has brought its P/S level with the rest of the industry. It's argued the price-to-sales ratio is an inferior measure of value within certain industries, but it can be a powerful business sentiment indicator.
Our look at ThredUp's revenue growth estimates show that its P/S is about what we expect, as both metrics follow closely with the industry averages. At this stage investors feel the potential for an improvement or deterioration in revenue isn't great enough to push P/S in a higher or lower direction. Unless these conditions change, they will continue to support the share price at these levels.
Don't forget that there may be other risks. For instance, we've identified 2 warning signs for ThredUp that you should be aware of.
Of course, profitable companies with a history of great earnings growth are generally safer bets. So you may wish to see this free collection of other companies that have reasonable P/E ratios and have grown earnings strongly.
Valuation is complex, but we're here to simplify it.
Discover if ThredUp might be undervalued or overvalued with our detailed analysis, featuring fair value estimates, potential risks, dividends, insider trades, and its financial condition.
Access Free AnalysisHave feedback on this article? Concerned about the content? Get in touch with us directly. Alternatively, email editorial-team (at) simplywallst.com.
This article by Simply Wall St is general in nature. We provide commentary based on historical data and analyst forecasts only using an unbiased methodology and our articles are not intended to be financial advice. It does not constitute a recommendation to buy or sell any stock, and does not take account of your objectives, or your financial situation. We aim to bring you long-term focused analysis driven by fundamental data. Note that our analysis may not factor in the latest price-sensitive company announcements or qualitative material. Simply Wall St has no position in any stocks mentioned.
About NasdaqGS:TDUP
Excellent balance sheet and fair value.
Similar Companies
Market Insights

Advertisement
Community Narratives
MicroVision will explode future revenue by 380.37% with a vision towards success
Fair Value US$60|98.4% undervalued
TH
Community Contributor
The Indispensable Artery for a New North American Economy
Fair Value CA$132.87|1.6% undervalued
TI
Community Contributor
Recently Updated Narratives
BE


Bejgal on MINISO Group Holding ·
MINISO's fair value is projected at 26.69 with an anticipated PE ratio shift of 20x
Fair Value:US$26.6928.0% undervalued
44 followersusers have followed this narrative
3 commentsusers have commented on this narrative
0 likesusers have liked this narrative
TI


TickerTickle on Oracle ·
The Quiet Giant That Became AI’s Power Grid
Fair Value:US$389.8149.5% undervalued
6 followersusers have followed this narrative
0 commentsusers have commented on this narrative
0 likesusers have liked this narrative
AU

AuCA on Nova Ljubljanska Banka d.d ·
Nova Ljubljanska Banka d.d will expect a 11.2% revenue boost driving future growth
Fair Value:€20916.3% undervalued
23 followersusers have followed this narrative
3 commentsusers have commented on this narrative
0 likesusers have liked this narrative
Popular Narratives
OS


oscargarcia on Alphabet ·
The company that turned a verb into a global necessity and basically runs the modern internet, digital ads, smartphones, maps, and AI.
Fair Value:US$3404.9% undervalued
134 followersusers have followed this narrative
6 commentsusers have commented on this narrative
18 likesusers have liked this narrative
TH

TheWallstreetKing on MicroVision ·
MicroVision will explode future revenue by 380.37% with a vision towards success
Fair Value:US$6098.4% undervalued
82 followersusers have followed this narrative
10 commentsusers have commented on this narrative
18 likesusers have liked this narrative
AN


AnalystConsensusTarget on NVIDIA ·
NVDA: Expanding AI Demand Will Drive Major Data Center Investments Through 2026
Fair Value:US$232.7923.6% undervalued
919 followersusers have followed this narrative
5 commentsusers have commented on this narrative
21 likesusers have liked this narrative