- United States
- /
- Specialty Stores
- /
- NasdaqGS:ROST
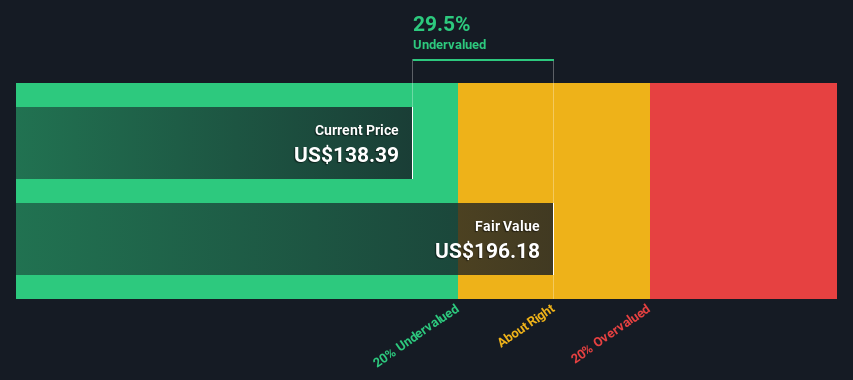
Is There An Opportunity With Ross Stores, Inc.'s (NASDAQ:ROST) 29% Undervaluation?


Key Insights
- Ross Stores' estimated fair value is US$196 based on 2 Stage Free Cash Flow to Equity
- Current share price of US$138 suggests Ross Stores is potentially 29% undervalued
- Analyst price target for ROST is US$135 which is 31% below our fair value estimate
Today we'll do a simple run through of a valuation method used to estimate the attractiveness of Ross Stores, Inc. (NASDAQ:ROST) as an investment opportunity by taking the expected future cash flows and discounting them to today's value. We will take advantage of the Discounted Cash Flow (DCF) model for this purpose. Believe it or not, it's not too difficult to follow, as you'll see from our example!
We would caution that there are many ways of valuing a company and, like the DCF, each technique has advantages and disadvantages in certain scenarios. Anyone interested in learning a bit more about intrinsic value should have a read of the Simply Wall St analysis model.
Check out our latest analysis for Ross Stores
The Method
We use what is known as a 2-stage model, which simply means we have two different periods of growth rates for the company's cash flows. Generally the first stage is higher growth, and the second stage is a lower growth phase. To begin with, we have to get estimates of the next ten years of cash flows. Where possible we use analyst estimates, but when these aren't available we extrapolate the previous free cash flow (FCF) from the last estimate or reported value. We assume companies with shrinking free cash flow will slow their rate of shrinkage, and that companies with growing free cash flow will see their growth rate slow, over this period. We do this to reflect that growth tends to slow more in the early years than it does in later years.
Generally we assume that a dollar today is more valuable than a dollar in the future, so we need to discount the sum of these future cash flows to arrive at a present value estimate:
10-year free cash flow (FCF) forecast
| 2024 | 2025 | 2026 | 2027 | 2028 | 2029 | 2030 | 2031 | 2032 | 2033 | |
| Levered FCF ($, Millions) | US$1.56b | US$1.64b | US$1.83b | US$2.66b | US$3.25b | US$3.69b | US$4.06b | US$4.38b | US$4.64b | US$4.87b |
| Growth Rate Estimate Source | Analyst x6 | Analyst x7 | Analyst x3 | Analyst x2 | Analyst x2 | Est @ 13.53% | Est @ 10.14% | Est @ 7.76% | Est @ 6.10% | Est @ 4.94% |
| Present Value ($, Millions) Discounted @ 7.5% | US$1.5k | US$1.4k | US$1.5k | US$2.0k | US$2.3k | US$2.4k | US$2.4k | US$2.4k | US$2.4k | US$2.4k |
("Est" = FCF growth rate estimated by Simply Wall St)
Present Value of 10-year Cash Flow (PVCF) = US$21b
After calculating the present value of future cash flows in the initial 10-year period, we need to calculate the Terminal Value, which accounts for all future cash flows beyond the first stage. The Gordon Growth formula is used to calculate Terminal Value at a future annual growth rate equal to the 5-year average of the 10-year government bond yield of 2.2%. We discount the terminal cash flows to today's value at a cost of equity of 7.5%.
Terminal Value (TV)= FCF2033 × (1 + g) ÷ (r – g) = US$4.9b× (1 + 2.2%) ÷ (7.5%– 2.2%) = US$94b
Present Value of Terminal Value (PVTV)= TV / (1 + r)10= US$94b÷ ( 1 + 7.5%)10= US$45b
The total value, or equity value, is then the sum of the present value of the future cash flows, which in this case is US$66b. The last step is to then divide the equity value by the number of shares outstanding. Compared to the current share price of US$138, the company appears a touch undervalued at a 29% discount to where the stock price trades currently. Valuations are imprecise instruments though, rather like a telescope - move a few degrees and end up in a different galaxy. Do keep this in mind.
The Assumptions
The calculation above is very dependent on two assumptions. The first is the discount rate and the other is the cash flows. If you don't agree with these result, have a go at the calculation yourself and play with the assumptions. The DCF also does not consider the possible cyclicality of an industry, or a company's future capital requirements, so it does not give a full picture of a company's potential performance. Given that we are looking at Ross Stores as potential shareholders, the cost of equity is used as the discount rate, rather than the cost of capital (or weighted average cost of capital, WACC) which accounts for debt. In this calculation we've used 7.5%, which is based on a levered beta of 1.062. Beta is a measure of a stock's volatility, compared to the market as a whole. We get our beta from the industry average beta of globally comparable companies, with an imposed limit between 0.8 and 2.0, which is a reasonable range for a stable business.
SWOT Analysis for Ross Stores
- Earnings growth over the past year exceeded the industry.
- Debt is not viewed as a risk.
- Dividends are covered by earnings and cash flows.
- Dividend is low compared to the top 25% of dividend payers in the Specialty Retail market.
- Annual earnings are forecast to grow for the next 3 years.
- Trading below our estimate of fair value by more than 20%.
- Annual earnings are forecast to grow slower than the American market.
Moving On:
Although the valuation of a company is important, it is only one of many factors that you need to assess for a company. It's not possible to obtain a foolproof valuation with a DCF model. Rather it should be seen as a guide to "what assumptions need to be true for this stock to be under/overvalued?" For example, changes in the company's cost of equity or the risk free rate can significantly impact the valuation. Can we work out why the company is trading at a discount to intrinsic value? For Ross Stores, we've compiled three important aspects you should look at:
- Risks: To that end, you should be aware of the 1 warning sign we've spotted with Ross Stores .
- Future Earnings: How does ROST's growth rate compare to its peers and the wider market? Dig deeper into the analyst consensus number for the upcoming years by interacting with our free analyst growth expectation chart.
- Other High Quality Alternatives: Do you like a good all-rounder? Explore our interactive list of high quality stocks to get an idea of what else is out there you may be missing!
PS. Simply Wall St updates its DCF calculation for every American stock every day, so if you want to find the intrinsic value of any other stock just search here.
New: AI Stock Screener & Alerts
Our new AI Stock Screener scans the market every day to uncover opportunities.
• Dividend Powerhouses (3%+ Yield)
• Undervalued Small Caps with Insider Buying
• High growth Tech and AI Companies
Or build your own from over 50 metrics.
Have feedback on this article? Concerned about the content? Get in touch with us directly. Alternatively, email editorial-team (at) simplywallst.com.
This article by Simply Wall St is general in nature. We provide commentary based on historical data and analyst forecasts only using an unbiased methodology and our articles are not intended to be financial advice. It does not constitute a recommendation to buy or sell any stock, and does not take account of your objectives, or your financial situation. We aim to bring you long-term focused analysis driven by fundamental data. Note that our analysis may not factor in the latest price-sensitive company announcements or qualitative material. Simply Wall St has no position in any stocks mentioned.
About NasdaqGS:ROST
Ross Stores
Operates off-price retail apparel and home fashion stores under the Ross Dress for Less and dd’s DISCOUNTS brand names in the United States.
Outstanding track record with excellent balance sheet.

