Advertisement
- United States
- /
- General Merchandise and Department Stores
- /
- NasdaqGS:PDD
Is There Value in PDD Holdings After Its 40% Rally and Global Expansion News?

Simply Wall St
Reviewed by Bailey Pemberton
- Ever wondered if PDD Holdings is a bargain or just riding a wave? You are not alone. With all the chatter about its market value, you are smart to take a closer look.
- The stock has jumped 40.1% year-to-date and is up 15.3% over the past year, signaling renewed optimism and a sense that growth potential is being recognized by investors.
- Fueling these moves, PDD Holdings recently made headlines by expanding its international e-commerce footprint and forging new partnerships. Both actions have earned investor confidence and sparked fresh debates about its long-term trajectory. At the same time, regulatory developments in China continue to create shifts in sentiment and keep the spotlight on key risks and rewards for the company.
- According to Simply Wall St’s valuation checks, PDD Holdings scores 5 out of 6 for being undervalued across multiple measures. Stick around to see not only how the numbers stack up using different approaches, but also to hear about an even sharper way to cut through the noise at the end of this article.
Find out why PDD Holdings's 15.3% return over the last year is lagging behind its peers.
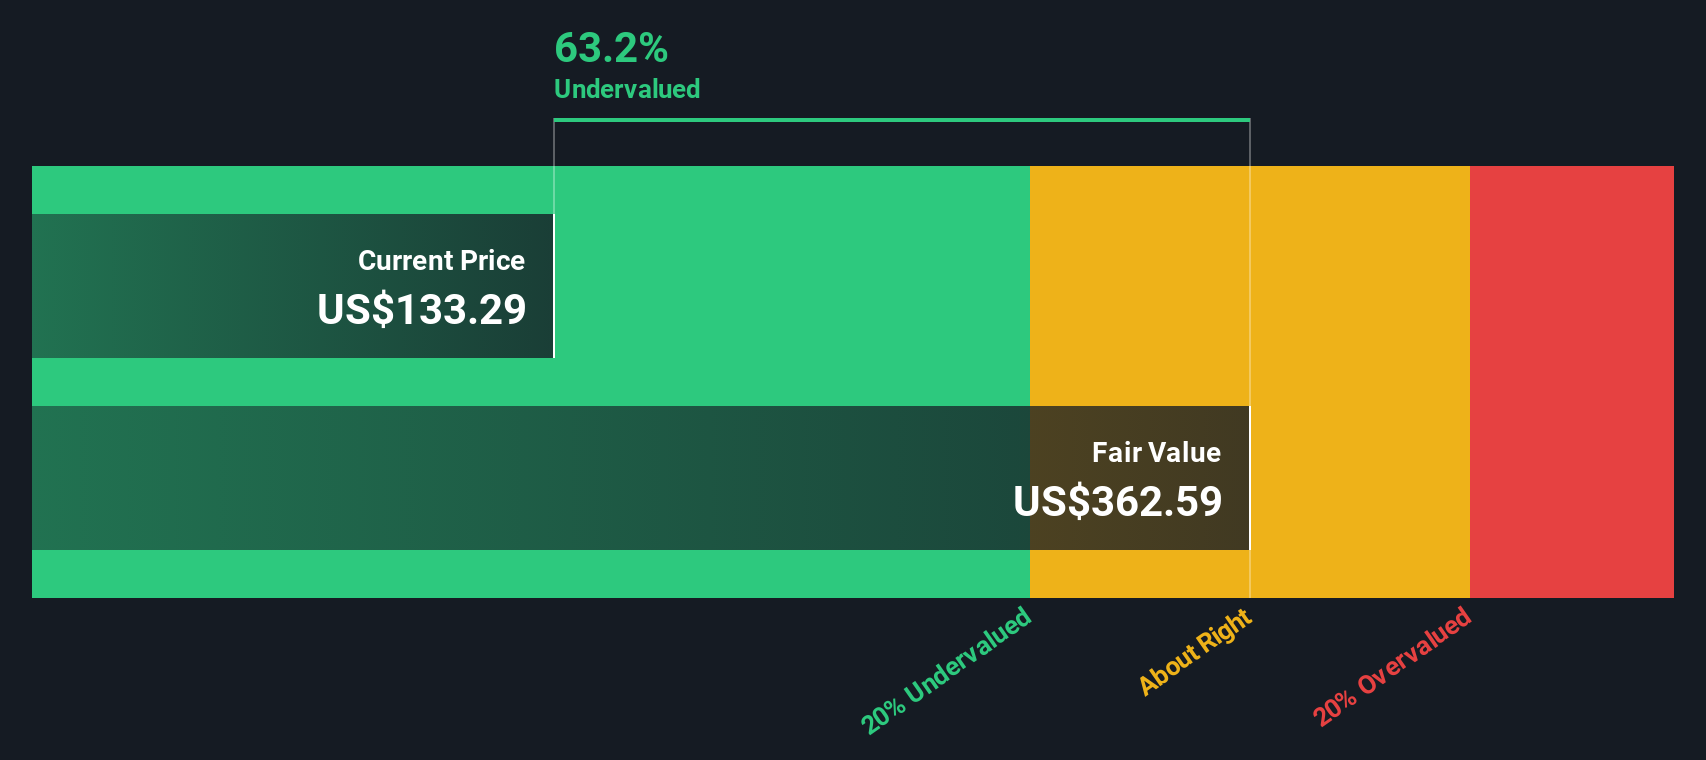
Approach 1: PDD Holdings Discounted Cash Flow (DCF) Analysis
A Discounted Cash Flow (DCF) analysis estimates a company's intrinsic value by projecting its future free cash flows and discounting them back to today's value. This approach helps investors assess whether a stock is trading above or below what its fundamentals may warrant.
For PDD Holdings, the DCF model uses a two-stage free cash flow to equity approach. The company's latest twelve-month free cash flow stands at approximately CN¥93.25 billion. Analysts forecast steady growth, with projections indicating free cash flow could reach about CN¥131.48 billion by 2026 and CN¥162.04 billion by 2027. Simply Wall St then extrapolates further, estimating free cash flow could climb to around CN¥290.72 billion in 2035.
Based on these projections and the company's discount rate, the model suggests PDD Holdings shares have an intrinsic value of $353.80. Compared to recent share prices, this estimate implies the stock is trading at a 61.6% discount to its fair value. This suggests the stock may be significantly undervalued by the market.
Result: UNDERVALUED
Our Discounted Cash Flow (DCF) analysis suggests PDD Holdings is undervalued by 61.6%. Track this in your watchlist or portfolio, or discover 874 more undervalued stocks based on cash flows.
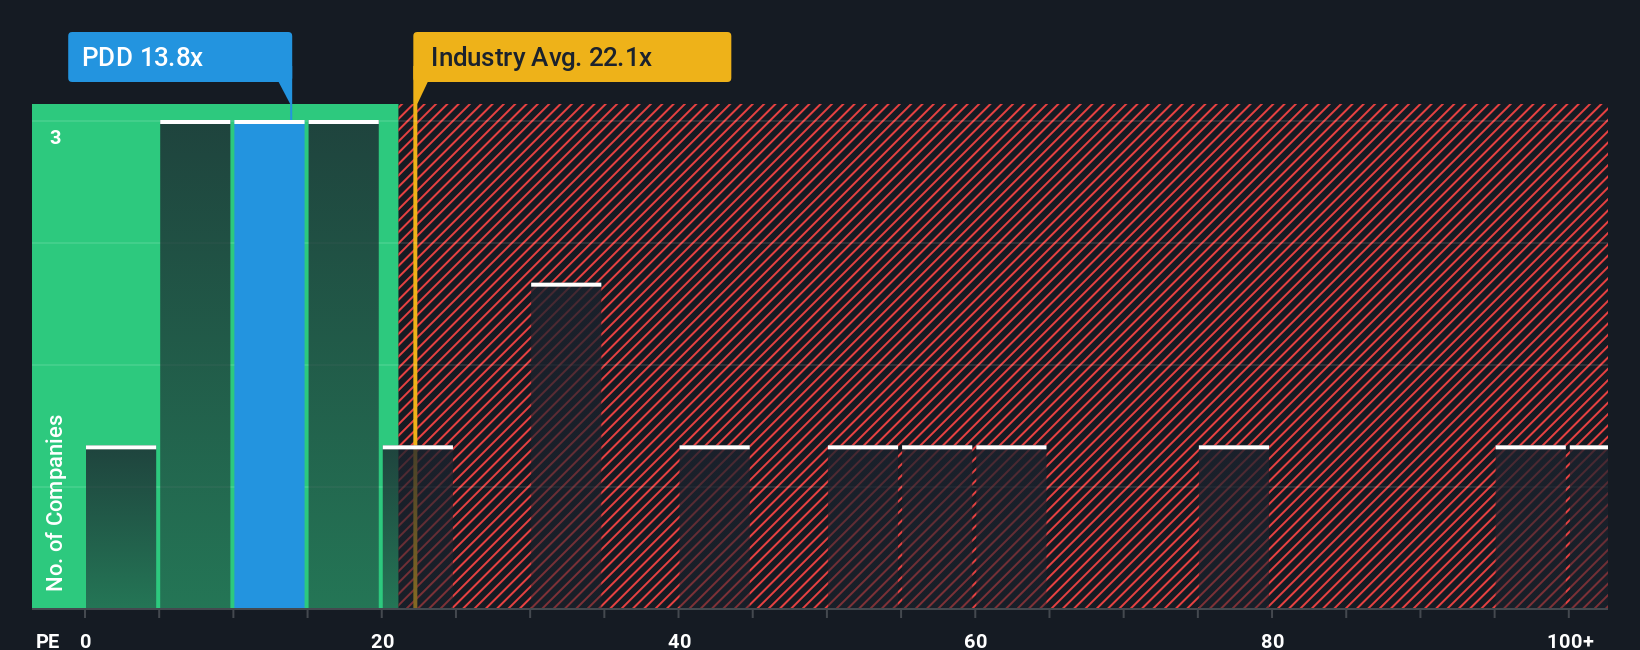
Approach 2: PDD Holdings Price vs Earnings (PE)
The Price-to-Earnings (PE) ratio is one of the most widely used metrics for valuing profitable companies like PDD Holdings. It offers a simple way to judge whether a stock's current price reflects the actual earnings power of the business, making it particularly relevant for investors trying to separate value from hype.
Growth expectations and risk both play a major role in what counts as a "fair" PE ratio. Stocks with strong earnings growth and lower risk typically command higher PE ratios. In contrast, slower growth or more uncertainty usually pushes the multiple down.
PDD Holdings currently trades at a PE ratio of 14x, which stands out as much lower than both its peer average of 69.71x and the Multiline Retail industry average of 19.87x. At first glance, this suggests the stock is undervalued relative to similar companies and the broader sector.
However, Simply Wall St’s proprietary "Fair Ratio" goes further than industry or peer averages. It calculates a custom multiple (26.91x in this case) by factoring in PDD's earnings growth, profitability, risk, market cap, and industry dynamics. This comprehensive view helps strip away noise from simple comparisons and matches the multiple to the company's true fundamentals.
Comparing PDD’s present PE ratio (14x) to its Fair Ratio (26.91x), the stock appears to be trading well below what long-term fundamentals suggest it is worth.
Result: UNDERVALUED
PE ratios tell one story, but what if the real opportunity lies elsewhere? Discover 1404 companies where insiders are betting big on explosive growth.
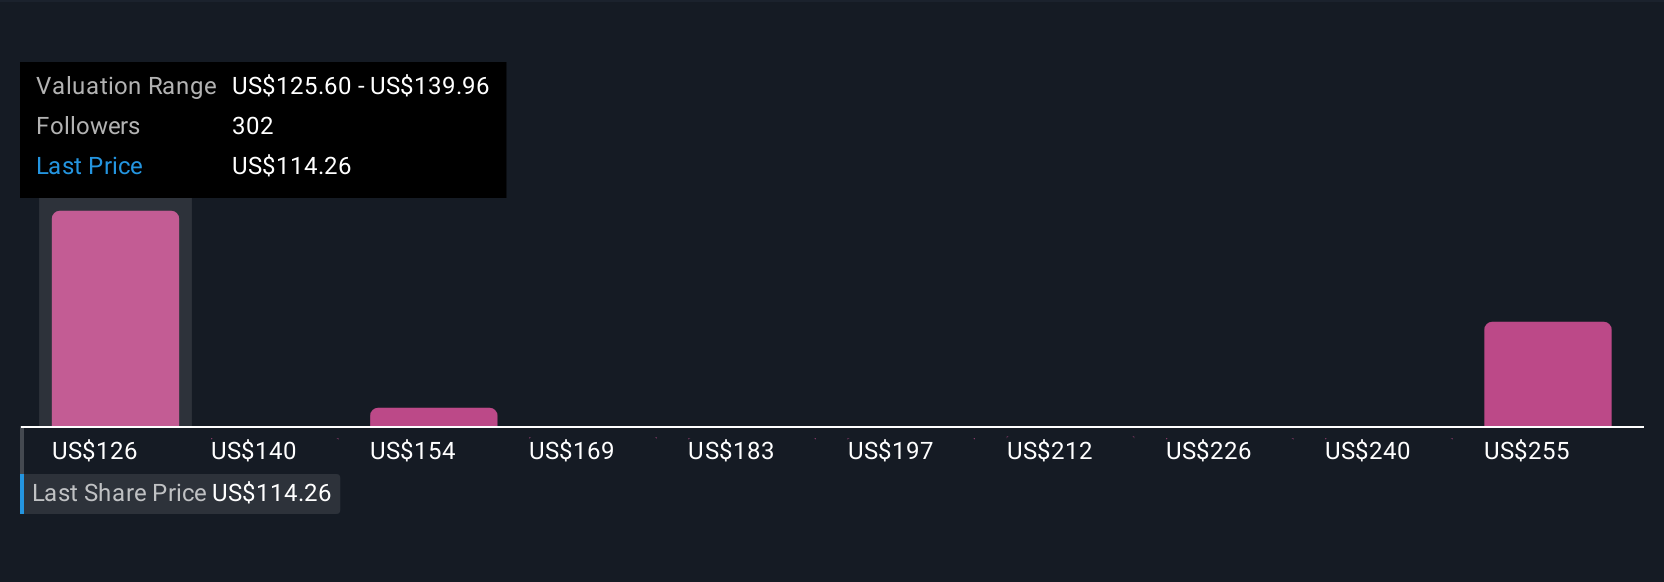
Upgrade Your Decision Making: Choose your PDD Holdings Narrative
Earlier we mentioned that there's an even better way to understand valuation, so let's introduce you to Narratives. A Narrative is simply your own story and viewpoint on a company. It’s the bridge between what you believe about PDD Holdings and how those beliefs shape your forecast for things like revenue, earnings, margins, and ultimately, what you think the fair value should be.
Instead of relying only on standard valuation numbers, Narratives let you put your assumptions to work: you set the key drivers, the platform calculates a personalized fair value, and you can instantly see how your outlook compares with current market prices. Narratives are easy to create and adjust on Simply Wall St's Community page, making them accessible for any investor, and since they update automatically when new results or news come in, your perspective always stays current and relevant.
For example, some PDD Holdings Narratives are optimistic, projecting a fair value as high as $176 per share and expecting rapid expansion, while more cautious views use lower fair values around $117, highlighting profitability risks and industry competition. By exploring Narratives, you get both the numbers and the story behind them, empowering smarter, more confident investment decisions driven by your own analysis.
Do you think there's more to the story for PDD Holdings? Head over to our Community to see what others are saying!
This article by Simply Wall St is general in nature. We provide commentary based on historical data and analyst forecasts only using an unbiased methodology and our articles are not intended to be financial advice. It does not constitute a recommendation to buy or sell any stock, and does not take account of your objectives, or your financial situation. We aim to bring you long-term focused analysis driven by fundamental data. Note that our analysis may not factor in the latest price-sensitive company announcements or qualitative material. Simply Wall St has no position in any stocks mentioned.
New: Manage All Your Stock Portfolios in One Place
We've created the ultimate portfolio companion for stock investors, and it's free.
• Connect an unlimited number of Portfolios and see your total in one currency
• Be alerted to new Warning Signs or Risks via email or mobile
• Track the Fair Value of your stocks
Have feedback on this article? Concerned about the content? Get in touch with us directly. Alternatively, email editorial-team@simplywallst.com
About NasdaqGS:PDD
PDD Holdings
A multinational commerce group that owns and operates a portfolio of businesses.
Flawless balance sheet and undervalued.
Similar Companies
Market Insights

Advertisement
Community Narratives
The "Molecular Pencil": Why Beam's Technology is Built to Win
Fair Value US$65.01|65.4% undervalued
DA
Community Contributor
The silent giant behind virtually every advanced chip powering AI, smartphones, and modern infrastructure.
Fair Value US$310.00|6.1% undervalued
OS
Community Contributor
ADP Stock: Solid Fundamentals, But AI Investments Test Its Margin Resilience
Fair Value US$387.77|34.2% undervalued
YI
Community Contributor
MINISO's fair value is projected at 26.69 with an anticipated PE ratio shift of 20x
Fair Value US$24.03|9.6% undervalued
BE
Community Contributor