- United States
- /
- Specialty Stores
- /
- NasdaqCM:NAAS
Market Participants Recognise NaaS Technology Inc.'s (NASDAQ:NAAS) Revenues

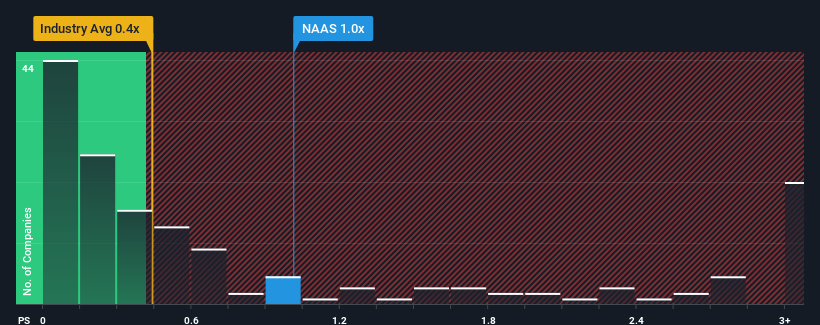
NaaS Technology Inc.'s (NASDAQ:NAAS) price-to-sales (or "P/S") ratio of 1x may not look like an appealing investment opportunity when you consider close to half the companies in the Specialty Retail industry in the United States have P/S ratios below 0.4x. Nonetheless, we'd need to dig a little deeper to determine if there is a rational basis for the elevated P/S.
See our latest analysis for NaaS Technology

How NaaS Technology Has Been Performing
NaaS Technology has been doing a decent job lately as it's been growing revenue at a reasonable pace. One possibility is that the P/S ratio is high because investors think this good revenue growth will be enough to outperform the broader industry in the near future. You'd really hope so, otherwise you're paying a pretty hefty price for no particular reason.
Although there are no analyst estimates available for NaaS Technology, take a look at this free data-rich visualisation to see how the company stacks up on earnings, revenue and cash flow.What Are Revenue Growth Metrics Telling Us About The High P/S?
There's an inherent assumption that a company should outperform the industry for P/S ratios like NaaS Technology's to be considered reasonable.
Taking a look back first, we see that the company managed to grow revenues by a handy 6.4% last year. While this performance is only fair, the company was still able to deliver immense revenue growth over the last three years. So we can start by confirming that the company has done a tremendous job of growing revenue over that time.
When compared to the industry's one-year growth forecast of 4.3%, the most recent medium-term revenue trajectory is noticeably more alluring
In light of this, it's understandable that NaaS Technology's P/S sits above the majority of other companies. It seems most investors are expecting this strong growth to continue and are willing to pay more for the stock.
The Key Takeaway
It's argued the price-to-sales ratio is an inferior measure of value within certain industries, but it can be a powerful business sentiment indicator.
We've established that NaaS Technology maintains its high P/S on the strength of its recent three-year growth being higher than the wider industry forecast, as expected. In the eyes of shareholders, the probability of a continued growth trajectory is great enough to prevent the P/S from pulling back. If recent medium-term revenue trends continue, it's hard to see the share price falling strongly in the near future under these circumstances.
You should always think about risks. Case in point, we've spotted 5 warning signs for NaaS Technology you should be aware of, and 2 of them are concerning.
If these risks are making you reconsider your opinion on NaaS Technology, explore our interactive list of high quality stocks to get an idea of what else is out there.
Valuation is complex, but we're here to simplify it.
Discover if NaaS Technology might be undervalued or overvalued with our detailed analysis, featuring fair value estimates, potential risks, dividends, insider trades, and its financial condition.
Access Free AnalysisHave feedback on this article? Concerned about the content? Get in touch with us directly. Alternatively, email editorial-team (at) simplywallst.com.
This article by Simply Wall St is general in nature. We provide commentary based on historical data and analyst forecasts only using an unbiased methodology and our articles are not intended to be financial advice. It does not constitute a recommendation to buy or sell any stock, and does not take account of your objectives, or your financial situation. We aim to bring you long-term focused analysis driven by fundamental data. Note that our analysis may not factor in the latest price-sensitive company announcements or qualitative material. Simply Wall St has no position in any stocks mentioned.
About NasdaqCM:NAAS
NaaS Technology
Provides electric vehicle (EV) charging services in China.
Moderate and slightly overvalued.
Market Insights
Community Narratives


