
Advertisement
- United States
- /
- Retail Distributors
- /
- NasdaqCM:JL
Market Cool On J-Long Group Limited's (NASDAQ:JL) Revenues Pushing Shares 27% Lower

Unfortunately for some shareholders, the J-Long Group Limited (NASDAQ:JL) share price has dived 27% in the last thirty days, prolonging recent pain. Longer-term shareholders will rue the drop in the share price, since it's now virtually flat for the year after a promising few quarters.
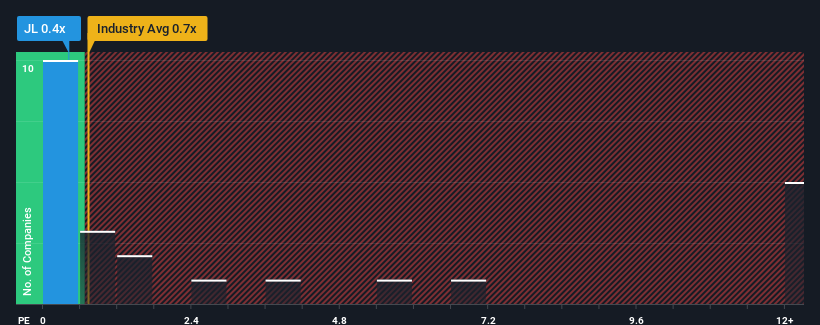
In spite of the heavy fall in price, you could still be forgiven for feeling indifferent about J-Long Group's P/S ratio of 0.4x, since the median price-to-sales (or "P/S") ratio for the Retail Distributors industry in the United States is also close to 0.5x. However, investors might be overlooking a clear opportunity or potential setback if there is no rational basis for the P/S.
See our latest analysis for J-Long Group
What Does J-Long Group's Recent Performance Look Like?
For example, consider that J-Long Group's financial performance has been poor lately as its revenue has been in decline. One possibility is that the P/S is moderate because investors think the company might still do enough to be in line with the broader industry in the near future. If not, then existing shareholders may be a little nervous about the viability of the share price.
Although there are no analyst estimates available for J-Long Group, take a look at this free data-rich visualisation to see how the company stacks up on earnings, revenue and cash flow.What Are Revenue Growth Metrics Telling Us About The P/S?
There's an inherent assumption that a company should be matching the industry for P/S ratios like J-Long Group's to be considered reasonable.
In reviewing the last year of financials, we were disheartened to see the company's revenues fell to the tune of 26%. This has soured the latest three-year period, which nevertheless managed to deliver a decent 21% overall rise in revenue. Although it's been a bumpy ride, it's still fair to say the revenue growth recently has been mostly respectable for the company.
Comparing that to the industry, which is only predicted to deliver 3.1% growth in the next 12 months, the company's momentum is stronger based on recent medium-term annualised revenue results.
In light of this, it's curious that J-Long Group's P/S sits in line with the majority of other companies. It may be that most investors are not convinced the company can maintain its recent growth rates.
The Bottom Line On J-Long Group's P/S
With its share price dropping off a cliff, the P/S for J-Long Group looks to be in line with the rest of the Retail Distributors industry. Typically, we'd caution against reading too much into price-to-sales ratios when settling on investment decisions, though it can reveal plenty about what other market participants think about the company.
We've established that J-Long Group currently trades on a lower than expected P/S since its recent three-year growth is higher than the wider industry forecast. There could be some unobserved threats to revenue preventing the P/S ratio from matching this positive performance. While recent revenue trends over the past medium-term suggest that the risk of a price decline is low, investors appear to see the likelihood of revenue fluctuations in the future.
We don't want to rain on the parade too much, but we did also find 5 warning signs for J-Long Group (2 are concerning!) that you need to be mindful of.
If these risks are making you reconsider your opinion on J-Long Group, explore our interactive list of high quality stocks to get an idea of what else is out there.
New: Manage All Your Stock Portfolios in One Place
We've created the ultimate portfolio companion for stock investors, and it's free.
• Connect an unlimited number of Portfolios and see your total in one currency
• Be alerted to new Warning Signs or Risks via email or mobile
• Track the Fair Value of your stocks
Have feedback on this article? Concerned about the content? Get in touch with us directly. Alternatively, email editorial-team (at) simplywallst.com.
This article by Simply Wall St is general in nature. We provide commentary based on historical data and analyst forecasts only using an unbiased methodology and our articles are not intended to be financial advice. It does not constitute a recommendation to buy or sell any stock, and does not take account of your objectives, or your financial situation. We aim to bring you long-term focused analysis driven by fundamental data. Note that our analysis may not factor in the latest price-sensitive company announcements or qualitative material. Simply Wall St has no position in any stocks mentioned.
Have feedback on this article? Concerned about the content? Get in touch with us directly. Alternatively, email editorial-team@simplywallst.com
About NasdaqCM:JL
J-Long Group
Distributes reflective and non-reflective garment trims in Asia, Hong Kong, the People’s Republic of China, and internationally.
Adequate balance sheet slight.
Market Insights


Advertisement
Community Narratives
A case for TSXV:USA to reach USD $5.00 - $9.00 (CAD $7.30–$12.29) by 2029.
Fair Value CA$12.29|91.2% undervalued
AG
Community Contributor
DLocal's Future Growth Fueled by 35% Revenue and Profit Margin Boosts
Fair Value US$195.39|94.1% undervalued
WY
Community Contributor
Historically Cheap, but the Margin of Safety Is Still Thin
Fair Value SEK 232.58|12.7% undervalued
MA
Community Contributor