Advertisement
- United States
- /
- Office REITs
- /
- NYSE:PGRE
Paramount Group’s 31.7% 2025 Surge Sparks Debate After Strong New York Leasing News

Simply Wall St
Reviewed by Bailey Pemberton
- Wondering whether Paramount Group is a hidden value opportunity or just another name in the real estate crowd? If you have even a passing interest in the stock’s true worth, you’re in the right place.
- The share price has quietly edged up 0.2% over the past week and year, but it is the eye-catching 31.7% surge so far this year that has really turned heads, suggesting changing perceptions around growth and risk.
- Recent headlines have focused on the company’s successful leasing activity in New York and fresh strategic partnerships, which many see as positive signs for future stability. At the same time, there’s been industry chatter about a rebound in commercial property demand that could further boost Paramount’s prospects.
- On our scorecard, Paramount Group hits a 3 out of 6 for undervaluation, a middle-of-the-pack rating that begs a closer look at what those numbers actually mean, especially since we’ll end this article by revealing an even better way to judge value than traditional metrics allow.
Approach 1: Paramount Group Discounted Cash Flow (DCF) Analysis
A Discounted Cash Flow (DCF) model estimates a company's intrinsic value by projecting its future cash flows, adjusting for factors like growth or risk, and then discounting those expected flows back to today's dollars. In this case, Paramount Group's valuation relies on its adjusted funds from operations, which offers deeper insight into its ongoing cash-generating potential.
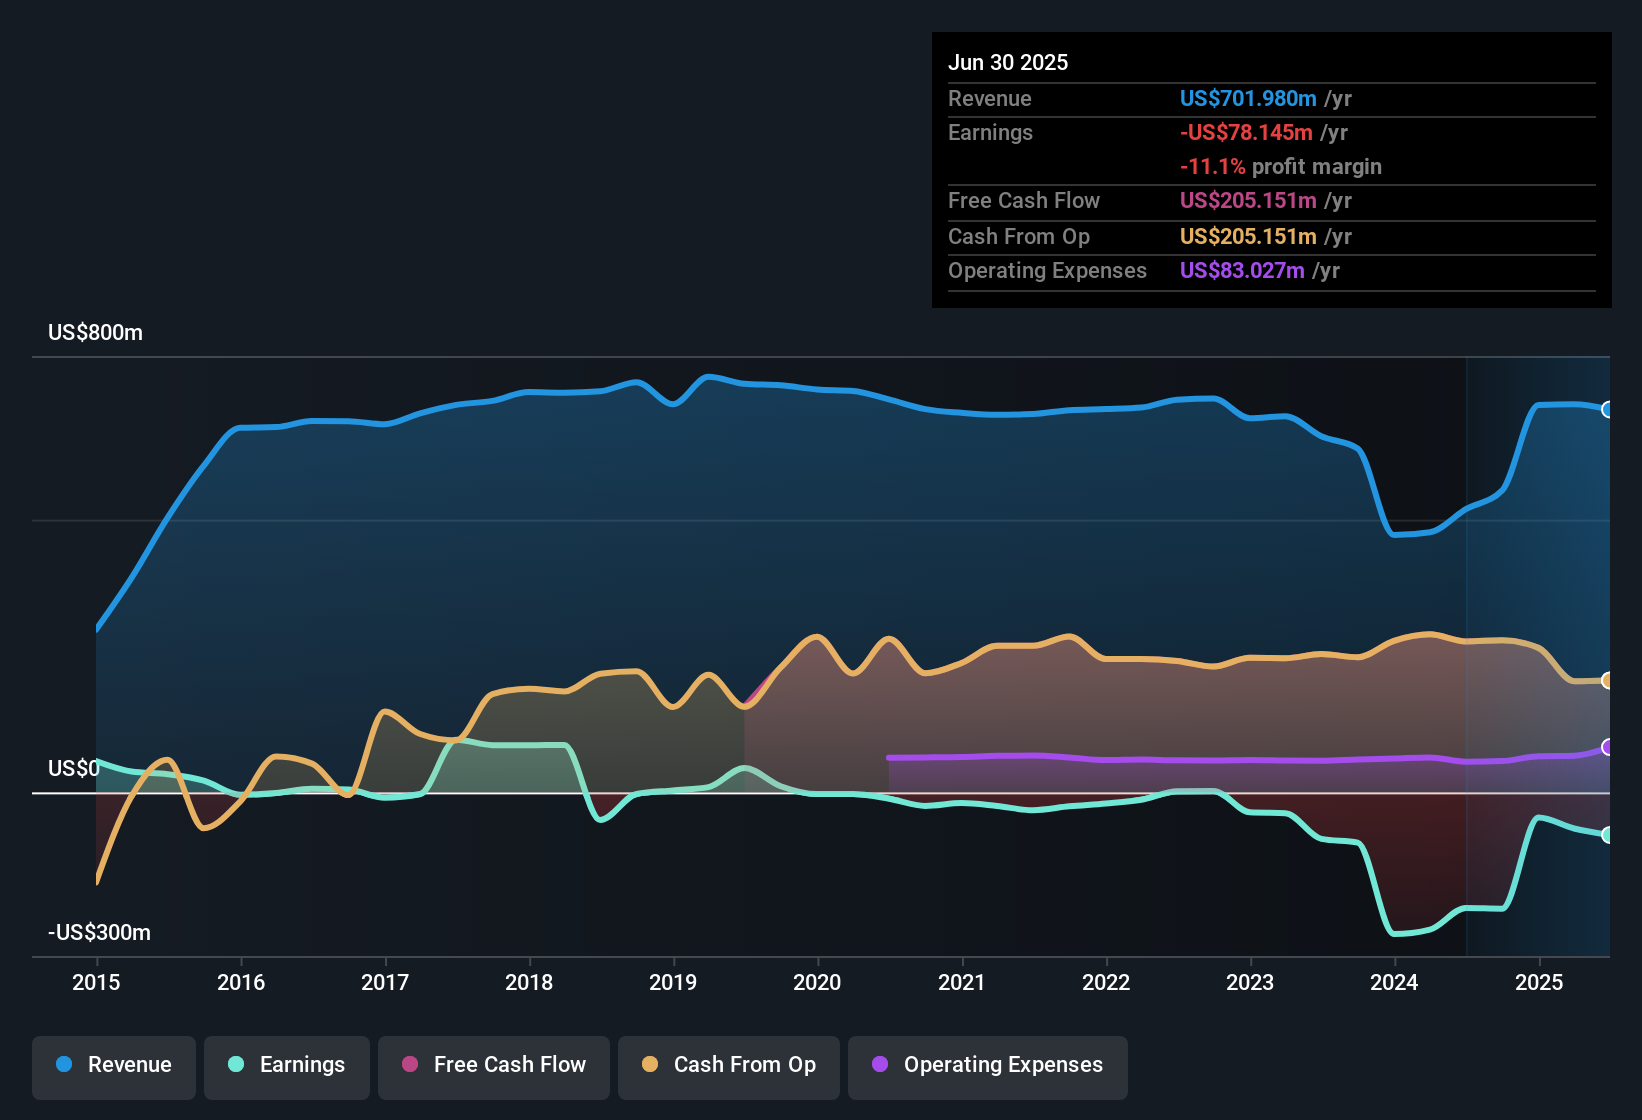
Paramount Group reported $178.8 million in free cash flow (FCF) for the last twelve months. Looking forward, analysts forecast a significant decline in annual FCF and project $17.8 million for 2027. Beyond that, Simply Wall St extrapolates further decreases, with FCF dropping to as low as $4.0 million in 2034. All projections are in US dollars, and the numbers reflect a cautious outlook for cash generation over the coming decade.
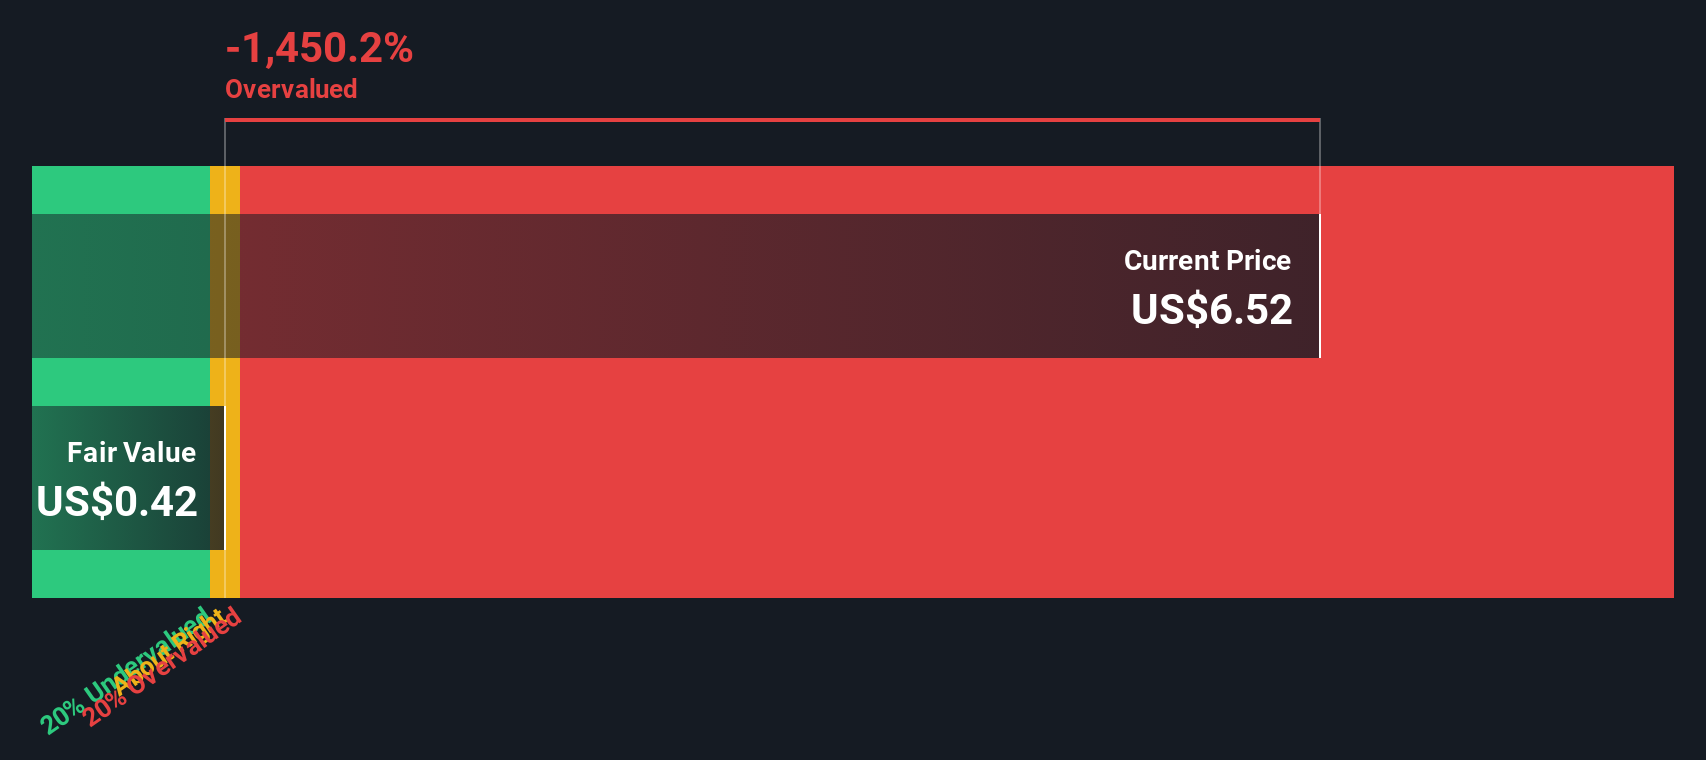
Based on these inputs, the DCF model estimates Paramount Group's intrinsic value at just $0.43 per share. With the current share price far above this mark, the analysis suggests the stock is trading at a 1433.4% premium to its intrinsic value according to this model. In other words, the DCF methodology considers the stock to be steeply overvalued.
Result: OVERVALUED
Our Discounted Cash Flow (DCF) analysis suggests Paramount Group may be overvalued by 1433.4%. Discover 855 undervalued stocks or create your own screener to find better value opportunities.
Approach 2: Paramount Group Price vs Sales
For real estate investment trusts like Paramount Group, the Price-to-Sales (P/S) ratio is often seen as a practical gauge of value. This is because sales figures are not as easily influenced by accounting choices and, for companies with unpredictable earnings, offer a more stable basis for comparison.
Growth expectations and risk play a significant role in determining what counts as a “normal” or “fair” P/S ratio. Companies with higher revenue growth or stronger positions in lower-risk markets typically command higher multiples, while low-growth or riskier plays might trade at a discount.
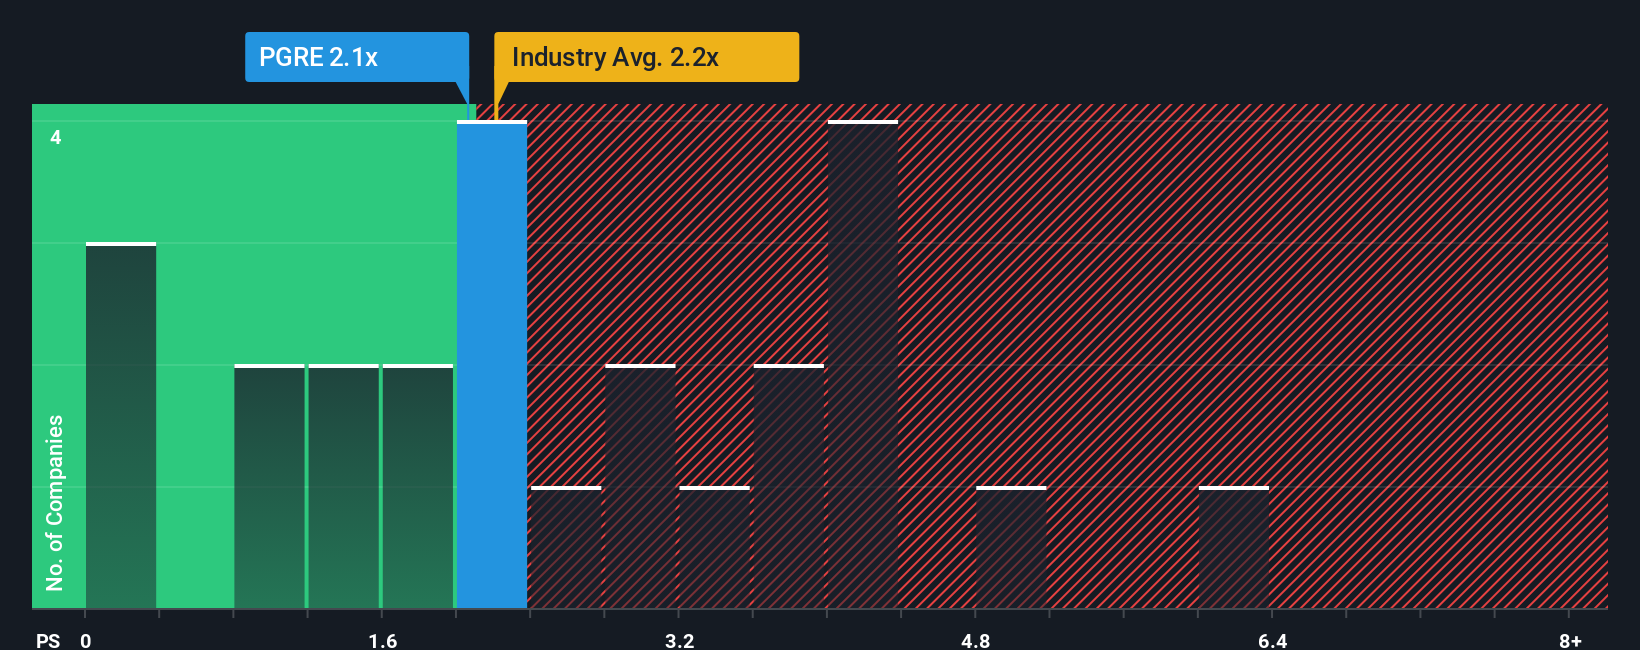
Currently, Paramount Group trades at a P/S ratio of 2.06x. This places it slightly below the Office REITs industry average of 2.20x and also beneath the 2.23x peer average. At first glance, this appears to point to a modest discount relative to its sector.
However, Simply Wall St’s proprietary “Fair Ratio” for Paramount Group comes in at 2.40x. This metric goes a step beyond simple comparisons, factoring in the company’s growth outlook, profit margins, risk profile, industry standards and market cap. As a result, it provides a tailored benchmark that is more finely tuned to Paramount Group’s circumstances than broader industry or peer averages.
With the company trading at 2.06x and a Fair Ratio of 2.40x, the stock is priced below what a reasonable, fundamentals-driven investor would expect. This suggests Paramount Group is currently undervalued based on this methodology.
Result: UNDERVALUED
PS ratios tell one story, but what if the real opportunity lies elsewhere? Discover 1404 companies where insiders are betting big on explosive growth.
Upgrade Your Decision Making: Choose your Paramount Group Narrative
Earlier we mentioned that there's an even better way to understand valuation, so let's introduce you to Narratives. A Narrative is simply your story behind a company's numbers, the assumptions you make about its future revenue, profits, and margins, which shape your view of its fair value. Narratives connect the story you see unfolding for Paramount Group to a real financial forecast, and then calculate a fair value grounded in those beliefs.
Narratives are accessible and easy to use within Simply Wall St's Community page, where millions of investors share perspectives, compare assumptions, and see how others are valuing the same company. By letting you compare your fair value with the current market price, Narratives offer a powerful way to decide when to buy or sell, informed by both data and your unique viewpoint.
What’s more, Narratives are dynamic and instantly update as new information comes in, like earnings results or industry news. For example, some Paramount Group Narratives reflect a highly optimistic outlook with a high fair value, while others, based on more cautious expectations, yield much lower estimates.
Do you think there's more to the story for Paramount Group? Head over to our Community to see what others are saying!
This article by Simply Wall St is general in nature. We provide commentary based on historical data and analyst forecasts only using an unbiased methodology and our articles are not intended to be financial advice. It does not constitute a recommendation to buy or sell any stock, and does not take account of your objectives, or your financial situation. We aim to bring you long-term focused analysis driven by fundamental data. Note that our analysis may not factor in the latest price-sensitive company announcements or qualitative material. Simply Wall St has no position in any stocks mentioned.
New: Manage All Your Stock Portfolios in One Place
We've created the ultimate portfolio companion for stock investors, and it's free.
• Connect an unlimited number of Portfolios and see your total in one currency
• Be alerted to new Warning Signs or Risks via email or mobile
• Track the Fair Value of your stocks
Have feedback on this article? Concerned about the content? Get in touch with us directly. Alternatively, email editorial-team@simplywallst.com
About NYSE:PGRE
Fair value with mediocre balance sheet.
Similar Companies
Market Insights

Advertisement
Community Narratives
The company that turned a verb into a global necessity and basically runs the modern internet, digital ads, smartphones, maps, and AI.
Fair Value US$300.00|6.2% undervalued
OS
Community Contributor
Flowers Foods Pays A Fair Price For Health
Fair Value US$16.12|25.1% undervalued
NV
Community Contributor
TMX Group will thrive with 33.3% profit margin and enduring market moat
Fair Value CA$49.90|0.04% overvalued
LI
Community Contributor