Advertisement
- United States
- /
- Retail REITs
- /
- NYSE:O
Evaluating Realty Income Stock After Recent Price Drop and Interest Rate Headlines in 2025

Simply Wall St
Reviewed by Bailey Pemberton
- Ever found yourself wondering if Realty Income is undervalued, priced just right, or trading at a premium? You are not alone, especially given the stock’s reputation among income-focused investors.
- After a strong start to the year with a 7.1% gain, Realty Income’s price has dipped by -2.7% over the last week and fallen -5.5% over the past month. This shows that even steady dividend favorites can see swings as sentiment and circumstances shift.
- Recent headlines around Realty Income have highlighted industry-wide conversations about interest rate trends and commercial property outlooks. These news stories have added to the dialogue about the company’s ability to navigate changing economic conditions and have given investors plenty to weigh beyond share price changes.
- As for valuation, Realty Income clocks in with a 2 out of 6 score on our value checks. This suggests there is room for further discussion on how fairly the market is pricing the business. Let’s take a look at the main valuation methods, and stay tuned because we will also share an approach that offers even more perspective by the end of the article.
Realty Income scores just 2/6 on our valuation checks. See what other red flags we found in the full valuation breakdown.
Approach 1: Realty Income Discounted Cash Flow (DCF) Analysis
The Discounted Cash Flow (DCF) model estimates a company's worth by projecting its future cash flows and discounting them back to today's value. For Realty Income, this approach uses adjusted funds from operations to calculate the probable value of the business.
Currently, Realty Income generates free cash flow of $3.62 billion annually. Analyst estimates extend for the next five years and suggest gradual growth, with cash flow projected to reach $4.70 billion by the end of 2029. After 2029, further growth projections are extrapolated to estimate how much cash the company could generate over the next decade.
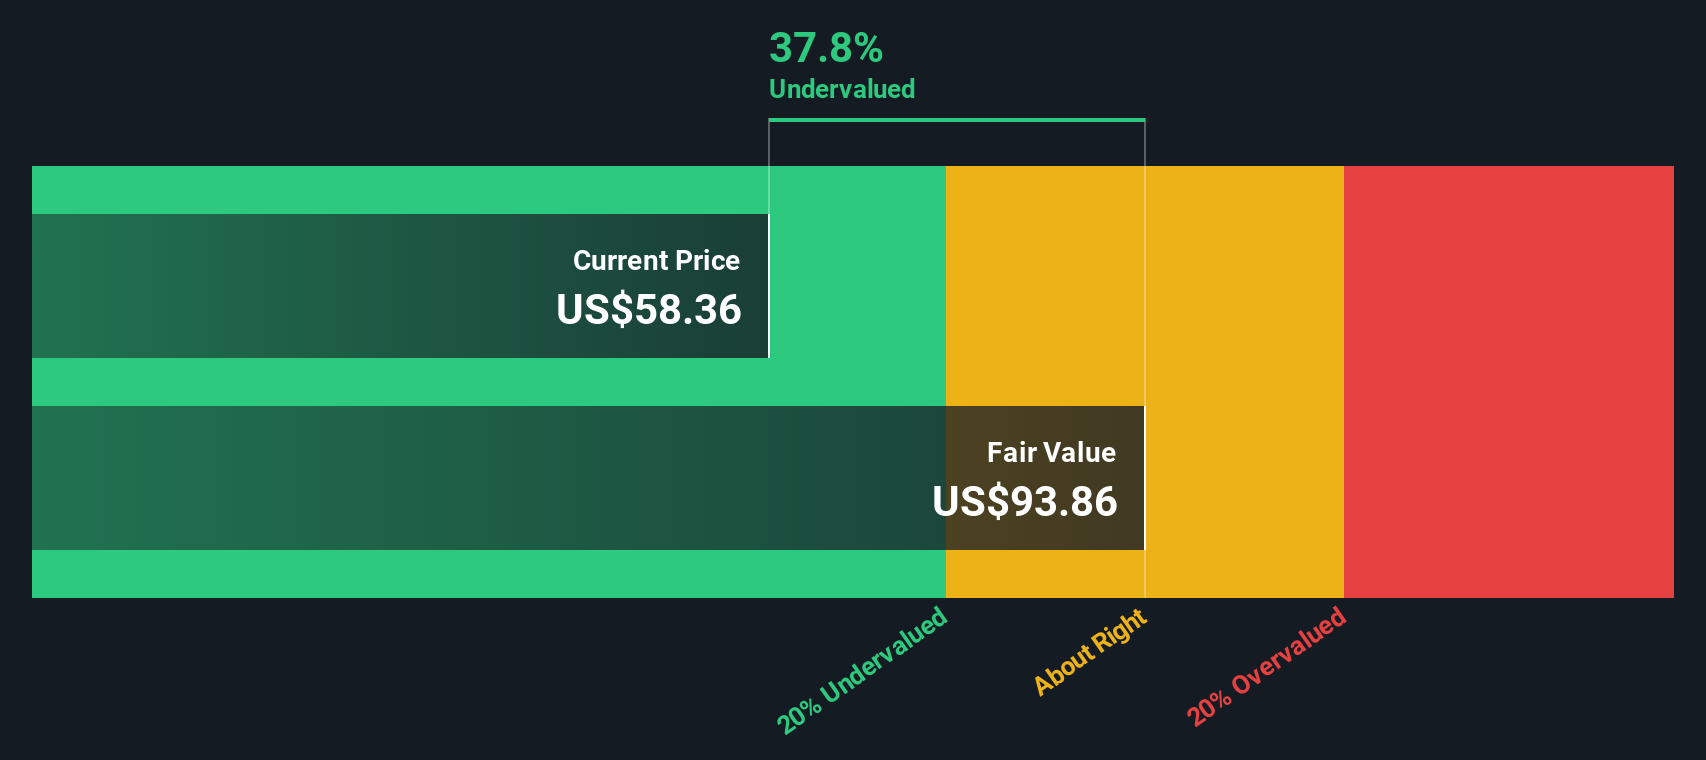
Based on these cash flow projections, the estimated intrinsic value per share is $97.09. Compared with the current share price, this implies Realty Income stock is trading at a 42.0% discount to its calculated fair value.
This sizable discount suggests that, according to the DCF model, Realty Income is significantly undervalued at current levels and could appeal to investors seeking value in the real estate sector.
Result: UNDERVALUED
Our Discounted Cash Flow (DCF) analysis suggests Realty Income is undervalued by 42.0%. Track this in your watchlist or portfolio, or discover 860 more undervalued stocks based on cash flows.
Approach 2: Realty Income Price vs Earnings
The price-to-earnings (PE) ratio is a popular and practical metric for valuing profitable companies like Realty Income, as it captures how much investors are willing to pay for each dollar of current earnings. The PE ratio is especially insightful here because earnings are a cornerstone for yield-focused real estate investment trusts (REITs), making it a widely used benchmark across the sector.
It is important to consider that growth expectations and risks will shape what constitutes a “normal” or “fair” PE. Companies with stronger anticipated earnings growth or lower risk profiles typically command higher PE ratios. On the other hand, those with uncertain growth prospects or greater risks are often assigned lower multiples by the market.
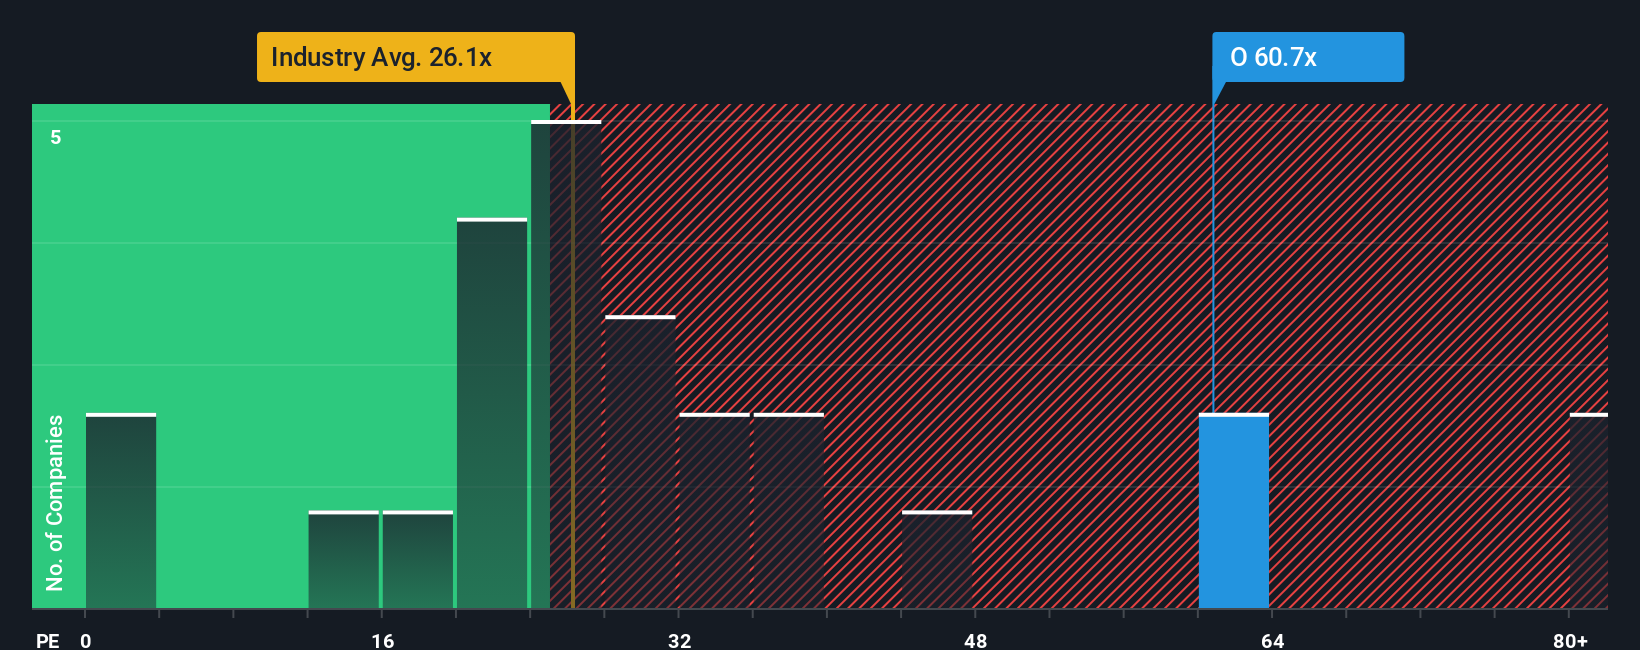
Realty Income currently trades on a PE ratio of 53.86x. This stands well above both the industry average for retail REITs of 28.79x and the peer average of 31.70x. While this initially suggests a premium, it is helpful to introduce Simply Wall St’s “Fair Ratio,” which in this case is 37.36x. The Fair Ratio is designed to filter out superficial comparisons by accounting for Realty Income’s unique mix of expected earnings growth, profit margins, risk factors, industry profile, and market cap.
Comparing the Fair Ratio to Realty Income’s current PE, the stock does look to be trading above what would typically be justified by its fundamentals. This indicates that, relative to what would be considered fair for its situation, Realty Income might currently be overvalued based on earnings.
Result: OVERVALUED
PE ratios tell one story, but what if the real opportunity lies elsewhere? Discover 1402 companies where insiders are betting big on explosive growth.
Upgrade Your Decision Making: Choose your Realty Income Narrative
Earlier we mentioned that there is an even better way to understand valuation, so let’s introduce you to Narratives. A Narrative is your personal perspective on a company. It is a story that ties together your own financial forecast, assumptions about growth, margins, and risk, and what you believe is a fair value for the stock. Narratives let you see how your viewpoint stacks up by linking a company's underlying story to its financial future, helping you make clearer buy or sell decisions by comparing your estimated Fair Value with today’s market price.
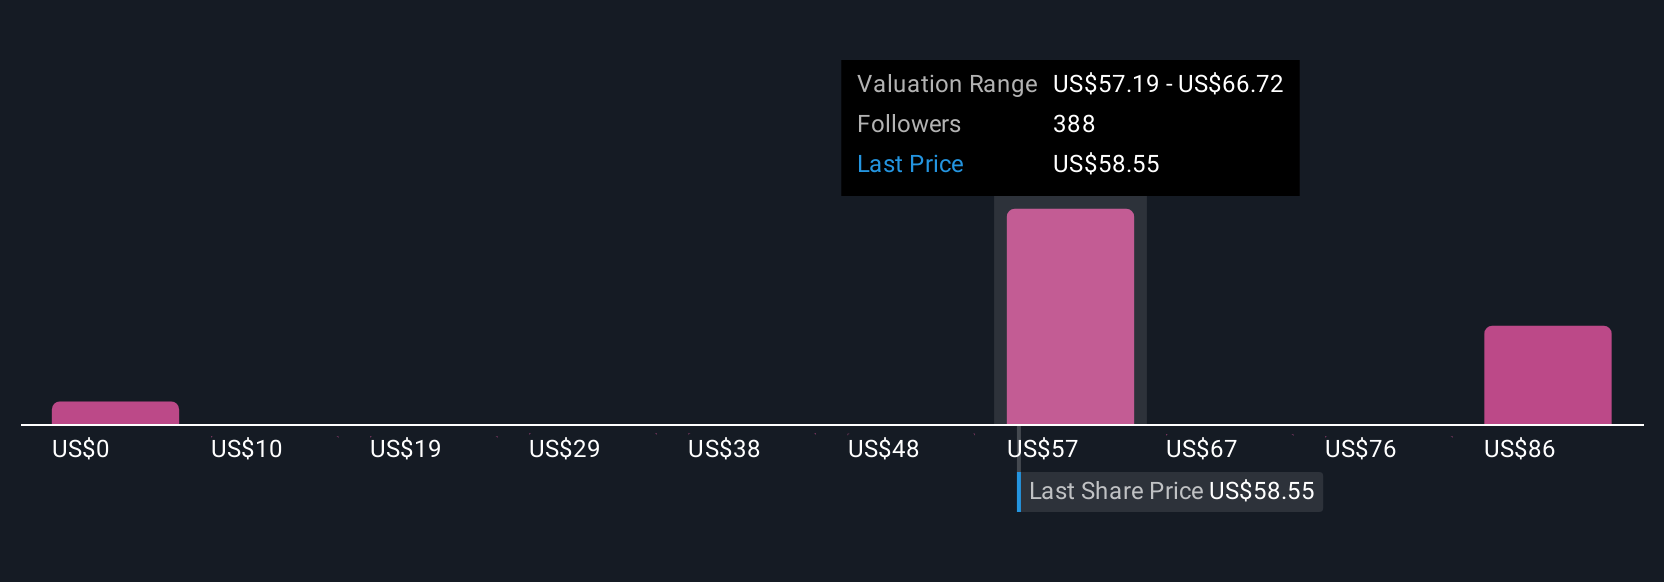
Narratives are an accessible tool on Simply Wall St's Community page, where millions of investors share and update their views in real time. They update automatically when new information, such as earnings or news, comes in, so your assessment always remains relevant. For example, with Realty Income, one investor may project moderate growth and a fair value of $61.26, concluding the stock is a “HOLD.” Another, more optimistic about global expansion, sees a fair value as high as $75.00 and believes there is significant upside. No matter your approach, Narratives provide a clear, dynamic way to connect your outlook to actionable investment decisions.
Do you think there's more to the story for Realty Income? Head over to our Community to see what others are saying!
This article by Simply Wall St is general in nature. We provide commentary based on historical data and analyst forecasts only using an unbiased methodology and our articles are not intended to be financial advice. It does not constitute a recommendation to buy or sell any stock, and does not take account of your objectives, or your financial situation. We aim to bring you long-term focused analysis driven by fundamental data. Note that our analysis may not factor in the latest price-sensitive company announcements or qualitative material. Simply Wall St has no position in any stocks mentioned.
New: AI Stock Screener & Alerts
Our new AI Stock Screener scans the market every day to uncover opportunities.
• Dividend Powerhouses (3%+ Yield)
• Undervalued Small Caps with Insider Buying
• High growth Tech and AI Companies
Or build your own from over 50 metrics.
Have feedback on this article? Concerned about the content? Get in touch with us directly. Alternatively, email editorial-team@simplywallst.com
About NYSE:O
Realty Income
Realty Income (NYSE: O), an S&P 500 company, is real estate partner to the world's leading companies.
6 star dividend payer and slightly overvalued.
Similar Companies
Market Insights

Advertisement
Community Narratives
The company that turned a verb into a global necessity and basically runs the modern internet, digital ads, smartphones, maps, and AI.
Fair Value US$300.00|5.1% undervalued
OS
Community Contributor
Flowers Foods Pays A Fair Price For Health
Fair Value US$16.12|27.7% undervalued
NV
Community Contributor
TMX Group will thrive with 33.3% profit margin and enduring market moat
Fair Value CA$49.90|0.2% overvalued
LI
Community Contributor
The "Molecular Pencil": Why Beam's Technology is Built to Win
Fair Value US$65.01|64.4% undervalued
DA
Community Contributor