
Advertisement

Some say volatility, rather than debt, is the best way to think about risk as an investor, but Warren Buffett famously said that 'Volatility is far from synonymous with risk.' When we think about how risky a company is, we always like to look at its use of debt, since debt overload can lead to ruin. We note that The St. Joe Company (NYSE:JOE) does have debt on its balance sheet. But the real question is whether this debt is making the company risky.
Why Does Debt Bring Risk?
Debt is a tool to help businesses grow, but if a business is incapable of paying off its lenders, then it exists at their mercy. Part and parcel of capitalism is the process of 'creative destruction' where failed businesses are mercilessly liquidated by their bankers. However, a more usual (but still expensive) situation is where a company must dilute shareholders at a cheap share price simply to get debt under control. By replacing dilution, though, debt can be an extremely good tool for businesses that need capital to invest in growth at high rates of return. The first thing to do when considering how much debt a business uses is to look at its cash and debt together.
View our latest analysis for St. Joe
What Is St. Joe's Debt?
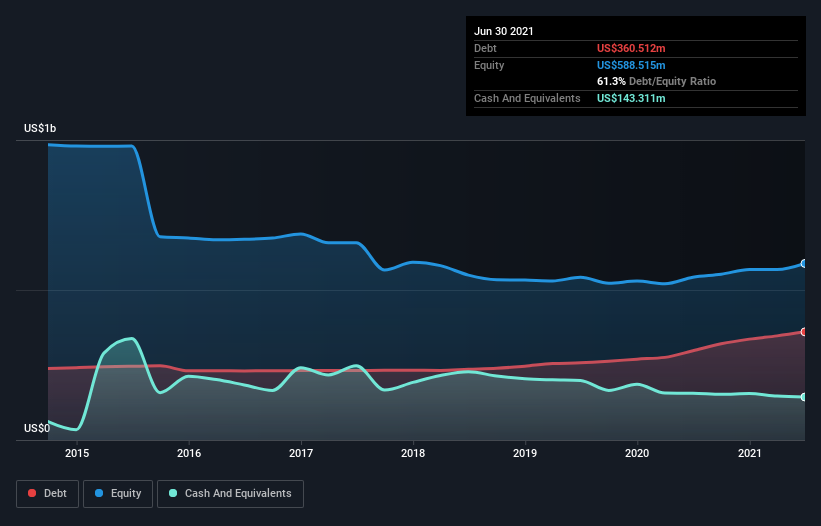
The image below, which you can click on for greater detail, shows that at June 2021 St. Joe had debt of US$360.5m, up from US$297.7m in one year. However, it does have US$143.3m in cash offsetting this, leading to net debt of about US$217.2m.
How Healthy Is St. Joe's Balance Sheet?
We can see from the most recent balance sheet that St. Joe had liabilities of US$47.1m falling due within a year, and liabilities of US$466.4m due beyond that. Offsetting this, it had US$143.3m in cash and US$55.1m in receivables that were due within 12 months. So its liabilities total US$315.1m more than the combination of its cash and short-term receivables.
Since publicly traded St. Joe shares are worth a total of US$2.72b, it seems unlikely that this level of liabilities would be a major threat. Having said that, it's clear that we should continue to monitor its balance sheet, lest it change for the worse.
In order to size up a company's debt relative to its earnings, we calculate its net debt divided by its earnings before interest, tax, depreciation, and amortization (EBITDA) and its earnings before interest and tax (EBIT) divided by its interest expense (its interest cover). Thus we consider debt relative to earnings both with and without depreciation and amortization expenses.
With a debt to EBITDA ratio of 2.5, St. Joe uses debt artfully but responsibly. And the alluring interest cover (EBIT of 10.0 times interest expense) certainly does not do anything to dispel this impression. Pleasingly, St. Joe is growing its EBIT faster than former Australian PM Bob Hawke downs a yard glass, boasting a 131% gain in the last twelve months. The balance sheet is clearly the area to focus on when you are analysing debt. But it is St. Joe's earnings that will influence how the balance sheet holds up in the future. So if you're keen to discover more about its earnings, it might be worth checking out this graph of its long term earnings trend.
Finally, a company can only pay off debt with cold hard cash, not accounting profits. So we clearly need to look at whether that EBIT is leading to corresponding free cash flow. During the last three years, St. Joe generated free cash flow amounting to a very robust 89% of its EBIT, more than we'd expect. That puts it in a very strong position to pay down debt.
Our View
St. Joe's conversion of EBIT to free cash flow suggests it can handle its debt as easily as Cristiano Ronaldo could score a goal against an under 14's goalkeeper. But truth be told we feel its net debt to EBITDA does undermine this impression a bit. Zooming out, St. Joe seems to use debt quite reasonably; and that gets the nod from us. While debt does bring risk, when used wisely it can also bring a higher return on equity. The balance sheet is clearly the area to focus on when you are analysing debt. But ultimately, every company can contain risks that exist outside of the balance sheet. For instance, we've identified 1 warning sign for St. Joe that you should be aware of.
At the end of the day, it's often better to focus on companies that are free from net debt. You can access our special list of such companies (all with a track record of profit growth). It's free.
If you decide to trade St. Joe, use the lowest-cost* platform that is rated #1 Overall by Barron’s, Interactive Brokers. Trade stocks, options, futures, forex, bonds and funds on 135 markets, all from a single integrated account. Promoted
New: Manage All Your Stock Portfolios in One Place
We've created the ultimate portfolio companion for stock investors, and it's free.
• Connect an unlimited number of Portfolios and see your total in one currency
• Be alerted to new Warning Signs or Risks via email or mobile
• Track the Fair Value of your stocks
This article by Simply Wall St is general in nature. We provide commentary based on historical data and analyst forecasts only using an unbiased methodology and our articles are not intended to be financial advice. It does not constitute a recommendation to buy or sell any stock, and does not take account of your objectives, or your financial situation. We aim to bring you long-term focused analysis driven by fundamental data. Note that our analysis may not factor in the latest price-sensitive company announcements or qualitative material. Simply Wall St has no position in any stocks mentioned.
*Interactive Brokers Rated Lowest Cost Broker by StockBrokers.com Annual Online Review 2020
Have feedback on this article? Concerned about the content? Get in touch with us directly. Alternatively, email editorial-team (at) simplywallst.com.
About NYSE:JOE
St. Joe
Operates as a real estate development, asset management, and operating company in the United States.
Questionable track record with imperfect balance sheet.
Similar Companies
Market Insights

Advertisement
Community Narratives
Vita Life Sciences Set for a 12.72% Revenue Growth While Tackling Operational Challenges
Fair Value AU$2.42|8.7% undervalued
RO
Community Contributor
Vossloh rides a €500 billion wave to boost growth and earnings in the next decade
Fair Value €78.41|6.3% undervalued
CH
Community Contributor
Intuitive Surgical Will Transform Healthcare with 12% Revenue Growth
Fair Value US$325.55|56.5% overvalued
UN
Community Contributor