Advertisement
- United States
- /
- Retail REITs
- /
- NYSE:GTY
How Getty Realty’s Recent Portfolio Expansion Impacts Its Share Price in 2025

Simply Wall St
Reviewed by Bailey Pemberton
- Wondering if Getty Realty might be a hidden gem or just fairly priced? This is a deep dive into how its shares stack up on value.
- The stock recently dipped 1.6% over the last week but is up 2.7% for the month. Even though it is down 7.3% year-to-date, investors have plenty to discuss regarding its future direction.
- Recent headlines focus on Getty Realty's ongoing property acquisitions and portfolio expansions, which have given investors new reasons to watch the stock. These developments have kept the company in the spotlight and contributed to evolving perceptions of both its growth story and risk profile.
- The current valuation score stands at 5 out of 6, signaling the company appears undervalued in most key areas. Next, we will break down how this score is determined and explore a more dynamic way to identify true value by the end of the article.
Find out why Getty Realty's -6.7% return over the last year is lagging behind its peers.
Approach 1: Getty Realty Discounted Cash Flow (DCF) Analysis
A Discounted Cash Flow (DCF) model estimates a company's value by projecting its future adjusted funds from operations and then discounting those cash flows back to today's value. For Getty Realty, this involves analyzing how much free cash the business can generate over time and what those future dollars are worth in present terms.
According to the latest data, Getty Realty produced $127.4 million in Free Cash Flow over the last twelve months. Analysts expect this figure to grow steadily, reaching $172.7 million by 2027. Simply Wall St uses analyst estimates for the next five years, while additional years are extrapolated to provide a broader ten-year outlook. By 2035, the company’s FCF is projected to approach $254.0 million.
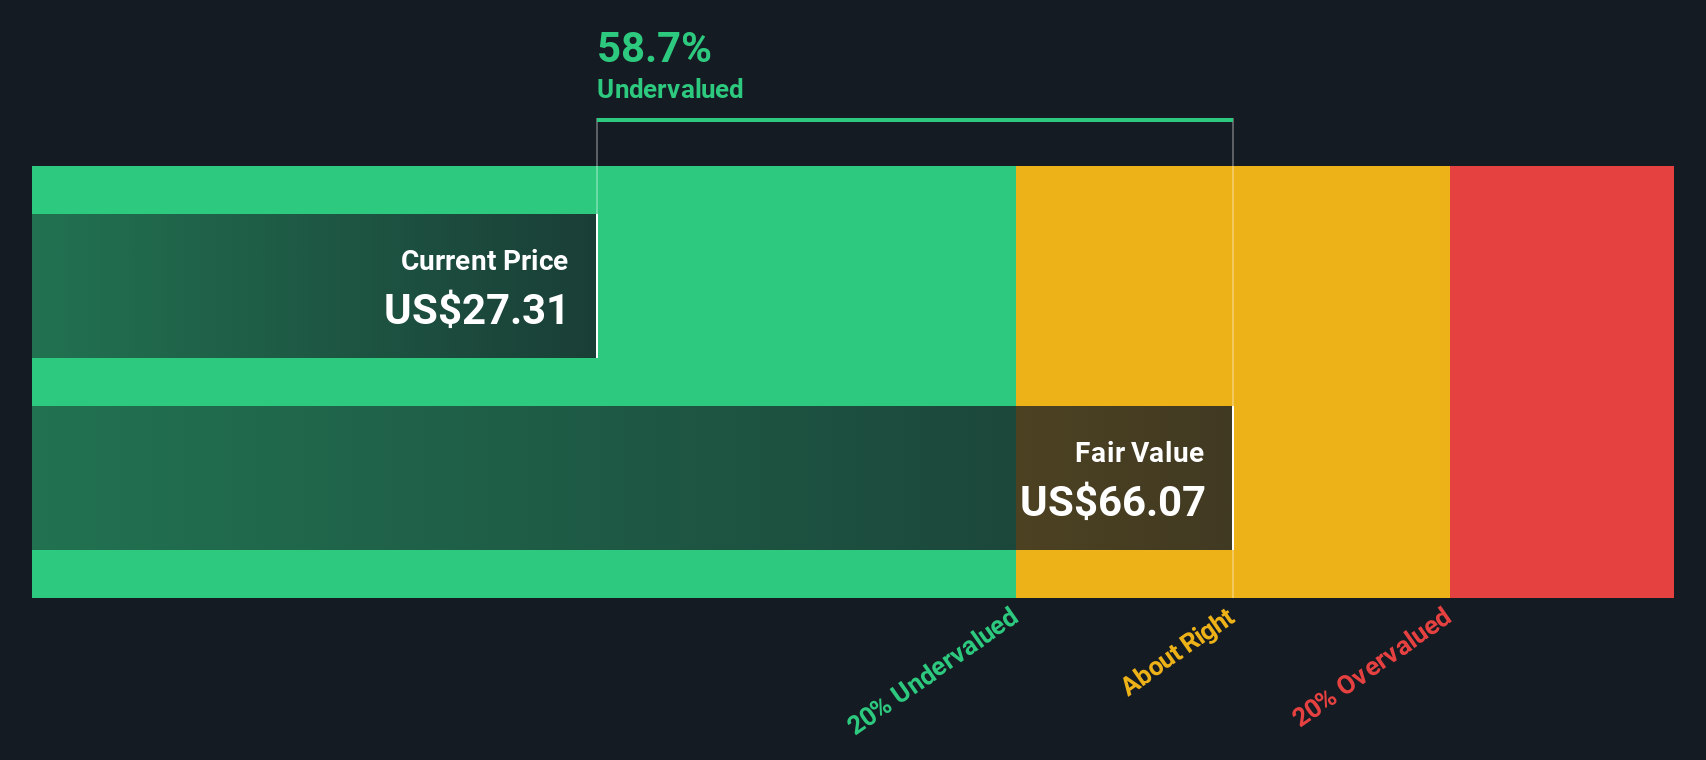
After discounting all future projected cash flows, the estimated intrinsic fair value for Getty Realty stock is $62.80 per share. This figure is based on the 2 Stage Free Cash Flow to Equity model using Adjusted Funds From Operations, and all projections are in US dollars.
Compared to the current share price, this DCF analysis suggests Getty Realty may be undervalued by about 56.3%. This level of discount can be notable for value-focused investors.
Result: UNDERVALUED
Our Discounted Cash Flow (DCF) analysis suggests Getty Realty is undervalued by 56.3%. Track this in your watchlist or portfolio, or discover 840 more undervalued stocks based on cash flows.
Approach 2: Getty Realty Price vs Earnings
For companies that are consistently profitable, the price-to-earnings (PE) ratio remains one of the most reliable ways to assess valuation. The PE ratio measures how much investors are willing to pay today for a dollar of current earnings. However, what constitutes a “fair” PE often depends on the company’s growth prospects and risk profile. A business expected to grow quickly or with very stable earnings often commands a higher ratio than slower-growing or riskier peers.
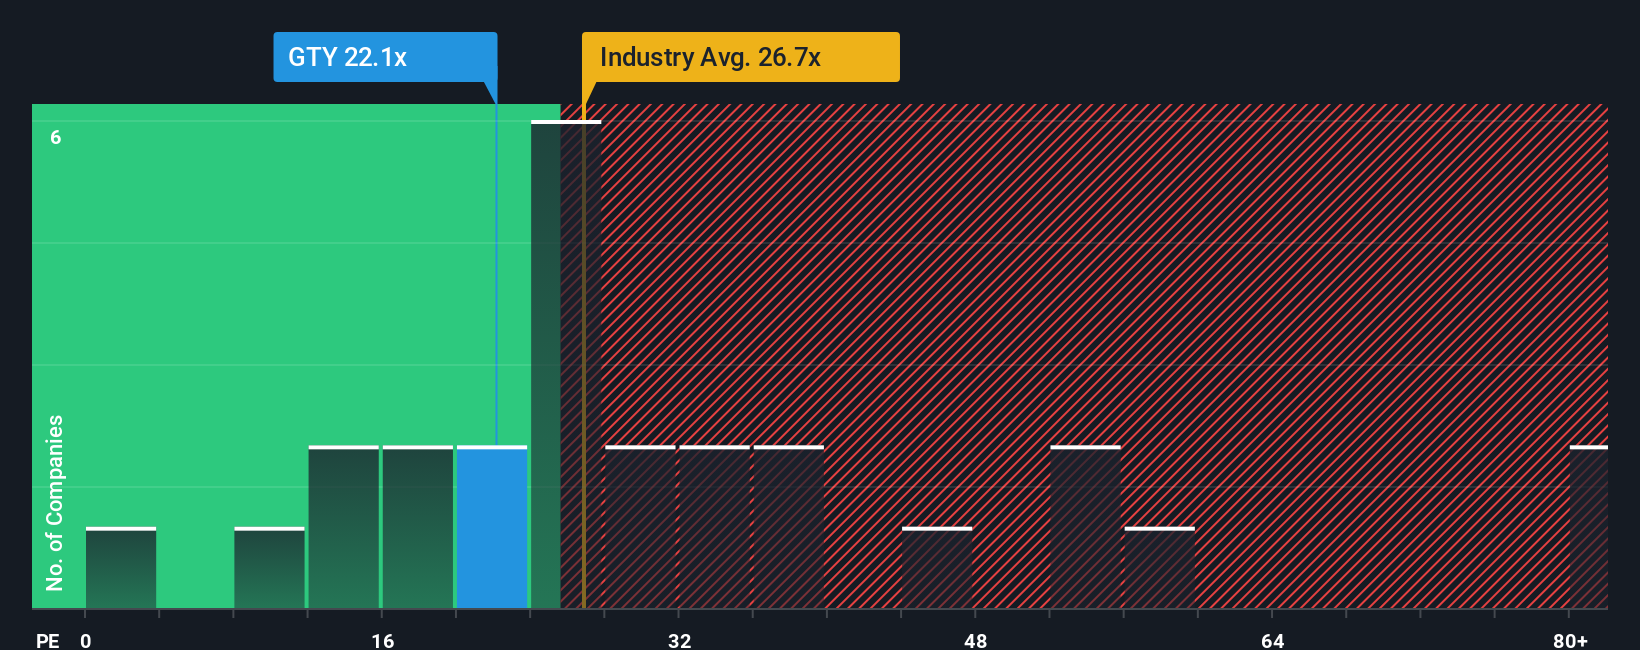
Getty Realty currently trades at a PE ratio of 22.2x. Compared to the average PE ratio of 26.0x across Retail REITs and a peer group average of 58.0x, Getty’s multiple suggests a notable discount to both industry norms and direct competitors. While on the surface this appears compelling, simply matching up PE ratios does not always tell the full story since company quality, growth outlook, profit margins, and risk can differ widely.
To give a more nuanced view, Simply Wall St calculates a proprietary “Fair Ratio” for each stock. In Getty’s case, that figure is 35.9x. This Fair Ratio goes beyond a peer or sector comparison, factoring in metrics like expected earnings growth, risk, profit margins, and company size. This makes it a more comprehensive benchmark for what Getty’s PE should be, given its unique profile.
The current PE ratio of 22.2x is well below the Fair Ratio of 35.9x. This means the stock is trading at a meaningful discount compared to where it would be fairly valued based on its fundamentals and outlook.
Result: UNDERVALUED
PE ratios tell one story, but what if the real opportunity lies elsewhere? Discover 1414 companies where insiders are betting big on explosive growth.
Upgrade Your Decision Making: Choose your Getty Realty Narrative
Earlier we mentioned that there's an even better way to understand valuation, so let's introduce you to Narratives. A Narrative is simply your story of what you believe will happen for a company like Getty Realty. It ties together your own assumptions about its future growth, earnings, and margins, and turns them into a personal fair value estimate.
Narratives connect the dots between what’s driving a company’s results, your financial forecast, and the current stock price. This makes the investment decision more transparent, dynamic, and truly yours. They are easy to use and available on Simply Wall St’s Community page, where millions of investors build, update, and share their Narratives in real-time.
With Narratives, you can clearly see how your expectations compare against others and instantly understand if Getty Realty’s current price is above or below your fair value. This helps you decide when or whether to buy or sell, and refines your thesis as new news or earnings come in.
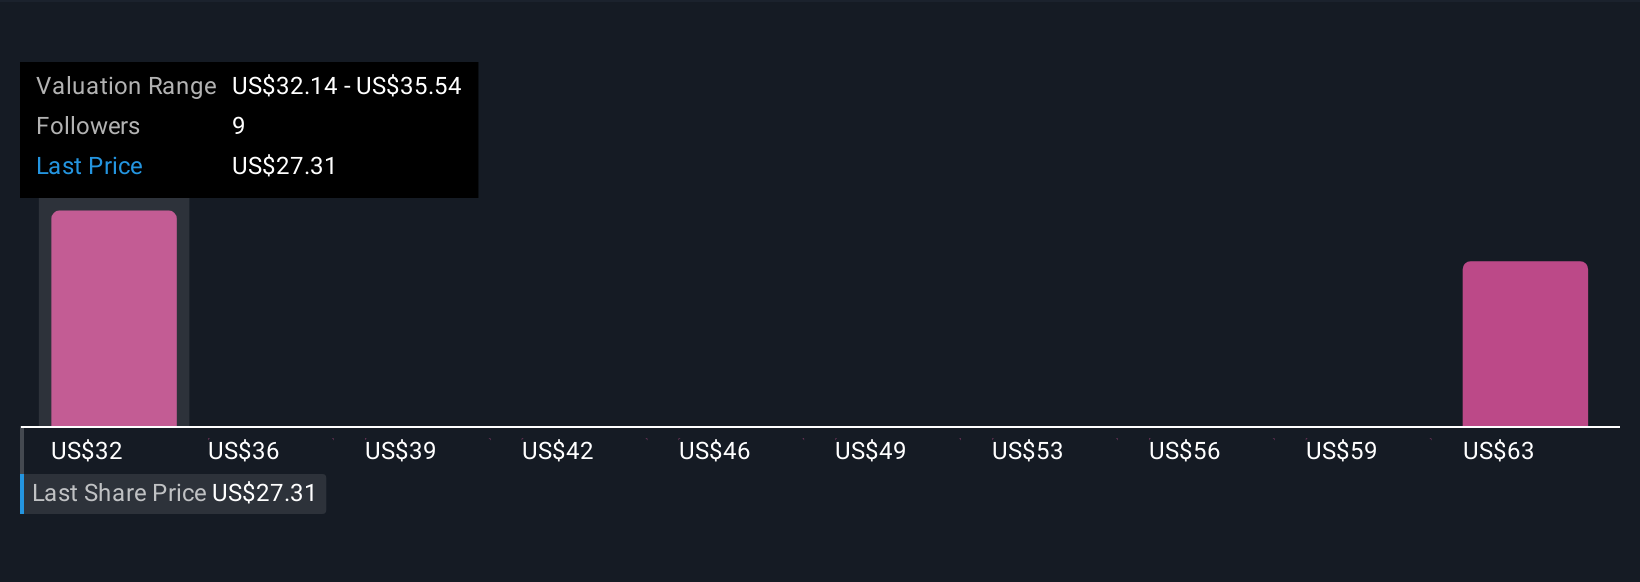
For example, one Narrative projects fair value near $32 based on moderate growth and steady margins, while another sees much higher upside for Getty if acquisitions drive faster expansion. This shows just how much your perspective, and your story, shapes the numbers.
Do you think there's more to the story for Getty Realty? Head over to our Community to see what others are saying!
This article by Simply Wall St is general in nature. We provide commentary based on historical data and analyst forecasts only using an unbiased methodology and our articles are not intended to be financial advice. It does not constitute a recommendation to buy or sell any stock, and does not take account of your objectives, or your financial situation. We aim to bring you long-term focused analysis driven by fundamental data. Note that our analysis may not factor in the latest price-sensitive company announcements or qualitative material. Simply Wall St has no position in any stocks mentioned.
New: Manage All Your Stock Portfolios in One Place
We've created the ultimate portfolio companion for stock investors, and it's free.
• Connect an unlimited number of Portfolios and see your total in one currency
• Be alerted to new Warning Signs or Risks via email or mobile
• Track the Fair Value of your stocks
Have feedback on this article? Concerned about the content? Get in touch with us directly. Alternatively, email editorial-team@simplywallst.com
About NYSE:GTY
Getty Realty
A publicly traded, net lease REIT specializing in the acquisition, financing and development of convenience, automotive and other single tenant retail real estate.
Undervalued established dividend payer.
Similar Companies
Market Insights

Advertisement
Community Narratives
The company that turned a verb into a global necessity and basically runs the modern internet, digital ads, smartphones, maps, and AI.
Fair Value US$300.00|6.3% undervalued
OS
Community Contributor
Flowers Foods Pays A Fair Price For Health
Fair Value US$16.12|26.0% undervalued
NV
Community Contributor
TMX Group will thrive with 33.3% profit margin and enduring market moat
Fair Value CA$49.90|3.7% overvalued
LI
Community Contributor