
Advertisement
- United States
- /
- Real Estate
- /
- NasdaqCM:MAYS
If You Had Bought J.W. Mays (NASDAQ:MAYS) Stock Five Years Ago, You'd Be Sitting On A 59% Loss, Today

Statistically speaking, long term investing is a profitable endeavour. But no-one is immune from buying too high. Zooming in on an example, the J.W. Mays, Inc. (NASDAQ:MAYS) share price dropped 59% in the last half decade. That is extremely sub-optimal, to say the least. And it's not just long term holders hurting, because the stock is down 46% in the last year. Shareholders have had an even rougher run lately, with the share price down 32% in the last 90 days. Of course, this share price action may well have been influenced by the 16% decline in the broader market, throughout the period.
See our latest analysis for J.W. Mays
To quote Buffett, 'Ships will sail around the world but the Flat Earth Society will flourish. There will continue to be wide discrepancies between price and value in the marketplace...' One imperfect but simple way to consider how the market perception of a company has shifted is to compare the change in the earnings per share (EPS) with the share price movement.
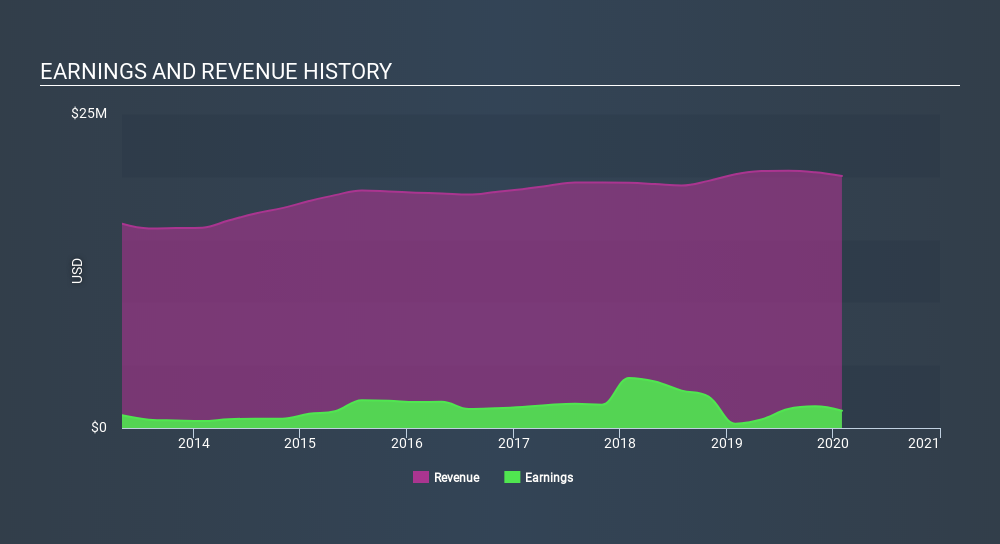
During the unfortunate half decade during which the share price slipped, J.W. Mays actually saw its earnings per share (EPS) improve by 4.0% per year. Given the share price reaction, one might suspect that EPS is not a good guide to the business performance during the period (perhaps due to a one-off loss or gain). Alternatively, growth expectations may have been unreasonable in the past.
By glancing at these numbers, we'd posit that the the market had expectations of much higher growth, five years ago. Looking to other metrics might better explain the share price change.
Revenue is actually up 2.1% over the time period. So it seems one might have to take closer look at the fundamentals to understand why the share price languishes. After all, there may be an opportunity.
You can see below how earnings and revenue have changed over time (discover the exact values by clicking on the image).
Take a more thorough look at J.W. Mays's financial health with this free report on its balance sheet.
A Different Perspective
We regret to report that J.W. Mays shareholders are down 46% for the year. Unfortunately, that's worse than the broader market decline of 4.0%. Having said that, it's inevitable that some stocks will be oversold in a falling market. The key is to keep your eyes on the fundamental developments. Regrettably, last year's performance caps off a bad run, with the shareholders facing a total loss of 16% per year over five years. Generally speaking long term share price weakness can be a bad sign, though contrarian investors might want to research the stock in hope of a turnaround. It's always interesting to track share price performance over the longer term. But to understand J.W. Mays better, we need to consider many other factors. Take risks, for example - J.W. Mays has 3 warning signs (and 1 which makes us a bit uncomfortable) we think you should know about.
We will like J.W. Mays better if we see some big insider buys. While we wait, check out this free list of growing companies with considerable, recent, insider buying.
Please note, the market returns quoted in this article reflect the market weighted average returns of stocks that currently trade on US exchanges.
If you spot an error that warrants correction, please contact the editor at editorial-team@simplywallst.com. This article by Simply Wall St is general in nature. It does not constitute a recommendation to buy or sell any stock, and does not take account of your objectives, or your financial situation. Simply Wall St has no position in the stocks mentioned.
We aim to bring you long-term focused research analysis driven by fundamental data. Note that our analysis may not factor in the latest price-sensitive company announcements or qualitative material. Thank you for reading.
About NasdaqCM:MAYS
J.W. Mays
Owns, operates, and leases commercial real estate properties in the United States.
Adequate balance sheet very low.
Similar Companies
Market Insights


Advertisement
Community Narratives
A case for TSXV:USA to reach USD $5.00 - $9.00 (CAD $7.30–$12.29) by 2029.
Fair Value CA$12.29|91.2% undervalued
AG
Community Contributor
DLocal's Future Growth Fueled by 35% Revenue and Profit Margin Boosts
Fair Value US$195.39|94.1% undervalued
WY
Community Contributor
Historically Cheap, but the Margin of Safety Is Still Thin
Fair Value SEK 232.58|12.7% undervalued
MA
Community Contributor