
Advertisement
- United States
- /
- Real Estate
- /
- NYSE:RMAX
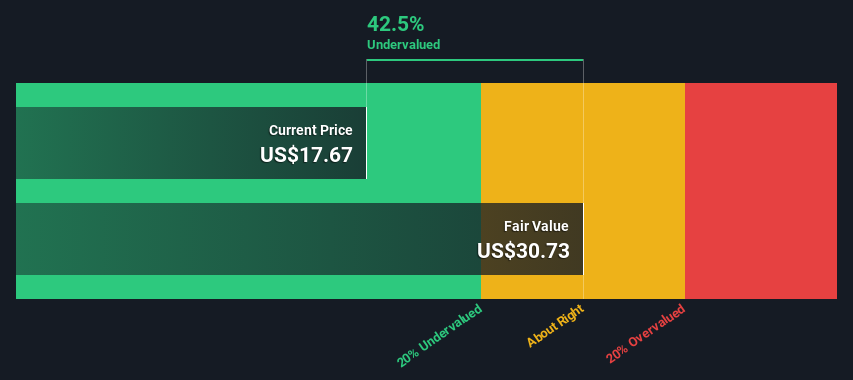
An Intrinsic Calculation For RE/MAX Holdings, Inc. (NYSE:RMAX) Suggests It's 42% Undervalued
Key Insights
- The projected fair value for RE/MAX Holdings is US$30.73 based on 2 Stage Free Cash Flow to Equity
- RE/MAX Holdings is estimated to be 42% undervalued based on current share price of US$17.67
- Analyst price target for RMAX is US$19.63 which is 36% below our fair value estimate
How far off is RE/MAX Holdings, Inc. (NYSE:RMAX) from its intrinsic value? Using the most recent financial data, we'll take a look at whether the stock is fairly priced by estimating the company's future cash flows and discounting them to their present value. Our analysis will employ the Discounted Cash Flow (DCF) model. There's really not all that much to it, even though it might appear quite complex.
We would caution that there are many ways of valuing a company and, like the DCF, each technique has advantages and disadvantages in certain scenarios. If you still have some burning questions about this type of valuation, take a look at the Simply Wall St analysis model.
View our latest analysis for RE/MAX Holdings
The Model
We are going to use a two-stage DCF model, which, as the name states, takes into account two stages of growth. The first stage is generally a higher growth period which levels off heading towards the terminal value, captured in the second 'steady growth' period. To begin with, we have to get estimates of the next ten years of cash flows. Where possible we use analyst estimates, but when these aren't available we extrapolate the previous free cash flow (FCF) from the last estimate or reported value. We assume companies with shrinking free cash flow will slow their rate of shrinkage, and that companies with growing free cash flow will see their growth rate slow, over this period. We do this to reflect that growth tends to slow more in the early years than it does in later years.
A DCF is all about the idea that a dollar in the future is less valuable than a dollar today, and so the sum of these future cash flows is then discounted to today's value:
10-year free cash flow (FCF) estimate
| 2024 | 2025 | 2026 | 2027 | 2028 | 2029 | 2030 | 2031 | 2032 | 2033 | |
| Levered FCF ($, Millions) | US$53.9m | US$61.1m | US$67.2m | US$72.4m | US$76.8m | US$80.5m | US$83.7m | US$86.7m | US$89.3m | US$91.8m |
| Growth Rate Estimate Source | Analyst x2 | Est @ 13.44% | Est @ 10.05% | Est @ 7.68% | Est @ 6.02% | Est @ 4.86% | Est @ 4.05% | Est @ 3.48% | Est @ 3.08% | Est @ 2.80% |
| Present Value ($, Millions) Discounted @ 9.7% | US$49.1 | US$50.7 | US$50.9 | US$49.9 | US$48.2 | US$46.1 | US$43.7 | US$41.2 | US$38.7 | US$36.3 |
("Est" = FCF growth rate estimated by Simply Wall St)
Present Value of 10-year Cash Flow (PVCF) = US$455m
The second stage is also known as Terminal Value, this is the business's cash flow after the first stage. The Gordon Growth formula is used to calculate Terminal Value at a future annual growth rate equal to the 5-year average of the 10-year government bond yield of 2.2%. We discount the terminal cash flows to today's value at a cost of equity of 9.7%.
Terminal Value (TV)= FCF2033 × (1 + g) ÷ (r – g) = US$92m× (1 + 2.2%) ÷ (9.7%– 2.2%) = US$1.2b
Present Value of Terminal Value (PVTV)= TV / (1 + r)10= US$1.2b÷ ( 1 + 9.7%)10= US$488m
The total value, or equity value, is then the sum of the present value of the future cash flows, which in this case is US$943m. The last step is to then divide the equity value by the number of shares outstanding. Compared to the current share price of US$17.7, the company appears quite good value at a 42% discount to where the stock price trades currently. Valuations are imprecise instruments though, rather like a telescope - move a few degrees and end up in a different galaxy. Do keep this in mind.
The Assumptions
We would point out that the most important inputs to a discounted cash flow are the discount rate and of course the actual cash flows. You don't have to agree with these inputs, I recommend redoing the calculations yourself and playing with them. The DCF also does not consider the possible cyclicality of an industry, or a company's future capital requirements, so it does not give a full picture of a company's potential performance. Given that we are looking at RE/MAX Holdings as potential shareholders, the cost of equity is used as the discount rate, rather than the cost of capital (or weighted average cost of capital, WACC) which accounts for debt. In this calculation we've used 9.7%, which is based on a levered beta of 1.517. Beta is a measure of a stock's volatility, compared to the market as a whole. We get our beta from the industry average beta of globally comparable companies, with an imposed limit between 0.8 and 2.0, which is a reasonable range for a stable business.
SWOT Analysis for RE/MAX Holdings
Strength
- Dividend is in the top 25% of dividend payers in the market.
Weakness
- Interest payments on debt are not well covered.
Opportunity
- Annual earnings are forecast to grow faster than the American market.
- Good value based on P/S ratio and estimated fair value.
Threat
- Debt is not well covered by operating cash flow.
- Dividends are not covered by earnings and cashflows.
- Annual revenue is forecast to grow slower than the American market.
Moving On:
Although the valuation of a company is important, it is only one of many factors that you need to assess for a company. DCF models are not the be-all and end-all of investment valuation. Preferably you'd apply different cases and assumptions and see how they would impact the company's valuation. For example, changes in the company's cost of equity or the risk free rate can significantly impact the valuation. What is the reason for the share price sitting below the intrinsic value? For RE/MAX Holdings, we've compiled three further factors you should consider:
- Risks: To that end, you should learn about the 3 warning signs we've spotted with RE/MAX Holdings (including 2 which can't be ignored) .
- Future Earnings: How does RMAX's growth rate compare to its peers and the wider market? Dig deeper into the analyst consensus number for the upcoming years by interacting with our free analyst growth expectation chart.
- Other Solid Businesses: Low debt, high returns on equity and good past performance are fundamental to a strong business. Why not explore our interactive list of stocks with solid business fundamentals to see if there are other companies you may not have considered!
PS. Simply Wall St updates its DCF calculation for every American stock every day, so if you want to find the intrinsic value of any other stock just search here.
New: AI Stock Screener & Alerts
Our new AI Stock Screener scans the market every day to uncover opportunities.
• Dividend Powerhouses (3%+ Yield)
• Undervalued Small Caps with Insider Buying
• High growth Tech and AI Companies
Or build your own from over 50 metrics.
Have feedback on this article? Concerned about the content? Get in touch with us directly. Alternatively, email editorial-team (at) simplywallst.com.
This article by Simply Wall St is general in nature. We provide commentary based on historical data and analyst forecasts only using an unbiased methodology and our articles are not intended to be financial advice. It does not constitute a recommendation to buy or sell any stock, and does not take account of your objectives, or your financial situation. We aim to bring you long-term focused analysis driven by fundamental data. Note that our analysis may not factor in the latest price-sensitive company announcements or qualitative material. Simply Wall St has no position in any stocks mentioned.
About NYSE:RMAX
RE/MAX Holdings
Operates as a franchisor of real estate brokerage services in the United States, Canada, and internationally.
Good value with low risk.
Similar Companies
Market Insights

Advertisement
Community Narratives
MicroVision will explode future revenue by 380.37% with a vision towards success
Fair Value US$60.00|98.4% undervalued
TH
Community Contributor
The Indispensable Artery for a New North American Economy
Fair Value CA$132.87|1.3% undervalued
TI
Community Contributor