
Advertisement
- United States
- /
- Capital Markets
- /
- NYSE:DBRG
Does DigitalBridge Group (NYSE:DBRG) Have A Healthy Balance Sheet?

David Iben put it well when he said, 'Volatility is not a risk we care about. What we care about is avoiding the permanent loss of capital.' It's only natural to consider a company's balance sheet when you examine how risky it is, since debt is often involved when a business collapses. We note that DigitalBridge Group, Inc. (NYSE:DBRG) does have debt on its balance sheet. But is this debt a concern to shareholders?
When Is Debt A Problem?
Debt assists a business until the business has trouble paying it off, either with new capital or with free cash flow. In the worst case scenario, a company can go bankrupt if it cannot pay its creditors. However, a more frequent (but still costly) occurrence is where a company must issue shares at bargain-basement prices, permanently diluting shareholders, just to shore up its balance sheet. Of course, plenty of companies use debt to fund growth, without any negative consequences. When we think about a company's use of debt, we first look at cash and debt together.
View our latest analysis for DigitalBridge Group
What Is DigitalBridge Group's Debt?
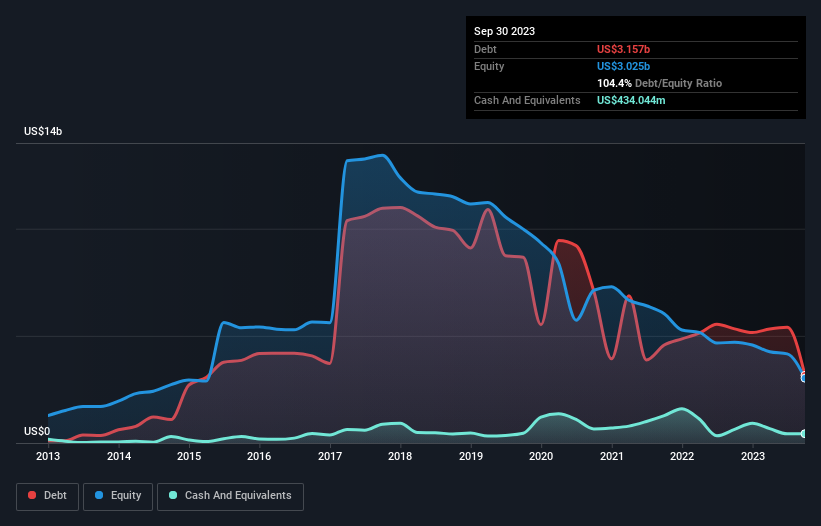
You can click the graphic below for the historical numbers, but it shows that DigitalBridge Group had US$3.16b of debt in September 2023, down from US$5.33b, one year before. However, it does have US$434.0m in cash offsetting this, leading to net debt of about US$2.72b.
A Look At DigitalBridge Group's Liabilities
Zooming in on the latest balance sheet data, we can see that DigitalBridge Group had liabilities of US$428.1m due within 12 months and liabilities of US$3.42b due beyond that. On the other hand, it had cash of US$434.0m and US$153.0m worth of receivables due within a year. So it has liabilities totalling US$3.26b more than its cash and near-term receivables, combined.
When you consider that this deficiency exceeds the company's US$3.00b market capitalization, you might well be inclined to review the balance sheet intently. Hypothetically, extremely heavy dilution would be required if the company were forced to pay down its liabilities by raising capital at the current share price.
In order to size up a company's debt relative to its earnings, we calculate its net debt divided by its earnings before interest, tax, depreciation, and amortization (EBITDA) and its earnings before interest and tax (EBIT) divided by its interest expense (its interest cover). This way, we consider both the absolute quantum of the debt, as well as the interest rates paid on it.
While we wouldn't worry about DigitalBridge Group's net debt to EBITDA ratio of 3.8, we think its super-low interest cover of 0.50 times is a sign of high leverage. It seems that the business incurs large depreciation and amortisation charges, so maybe its debt load is heavier than it would first appear, since EBITDA is arguably a generous measure of earnings. So shareholders should probably be aware that interest expenses appear to have really impacted the business lately. However, the silver lining was that DigitalBridge Group achieved a positive EBIT of US$115m in the last twelve months, an improvement on the prior year's loss. The balance sheet is clearly the area to focus on when you are analysing debt. But ultimately the future profitability of the business will decide if DigitalBridge Group can strengthen its balance sheet over time. So if you're focused on the future you can check out this free report showing analyst profit forecasts.
Finally, while the tax-man may adore accounting profits, lenders only accept cold hard cash. So it's worth checking how much of the earnings before interest and tax (EBIT) is backed by free cash flow. Over the last year, DigitalBridge Group actually produced more free cash flow than EBIT. That sort of strong cash generation warms our hearts like a puppy in a bumblebee suit.
Our View
Neither DigitalBridge Group's ability to cover its interest expense with its EBIT nor its level of total liabilities gave us confidence in its ability to take on more debt. But its conversion of EBIT to free cash flow tells a very different story, and suggests some resilience. When we consider all the factors discussed, it seems to us that DigitalBridge Group is taking some risks with its use of debt. So while that leverage does boost returns on equity, we wouldn't really want to see it increase from here. While DigitalBridge Group didn't make a statutory profit in the last year, its positive EBIT suggests that profitability might not be far away. Click here to see if its earnings are heading in the right direction, over the medium term.
If, after all that, you're more interested in a fast growing company with a rock-solid balance sheet, then check out our list of net cash growth stocks without delay.
New: Manage All Your Stock Portfolios in One Place
We've created the ultimate portfolio companion for stock investors, and it's free.
• Connect an unlimited number of Portfolios and see your total in one currency
• Be alerted to new Warning Signs or Risks via email or mobile
• Track the Fair Value of your stocks
Have feedback on this article? Concerned about the content? Get in touch with us directly. Alternatively, email editorial-team (at) simplywallst.com.
This article by Simply Wall St is general in nature. We provide commentary based on historical data and analyst forecasts only using an unbiased methodology and our articles are not intended to be financial advice. It does not constitute a recommendation to buy or sell any stock, and does not take account of your objectives, or your financial situation. We aim to bring you long-term focused analysis driven by fundamental data. Note that our analysis may not factor in the latest price-sensitive company announcements or qualitative material. Simply Wall St has no position in any stocks mentioned.
About NYSE:DBRG
Excellent balance sheet with moderate growth potential.
Similar Companies
Market Insights


Advertisement
Community Narratives
A Quality Compounder Marked Down on Overblown Fears
Fair Value US$120.72|62.4% undervalued
BA
Community Contributor

Wyndham Continues Global Expansion with 19% Ancillary Revenue Growth
Fair Value US$105.80|19.2% undervalued
ZW
Community Contributor