Advertisement
- United States
- /
- Pharma
- /
- NYSE:NVO
Is Novo Nordisk’s Recent 41% Share Price Drop Signaling a Value Opportunity in 2025?

Simply Wall St
Reviewed by Bailey Pemberton
- Curious whether Novo Nordisk stock is truly undervalued, or if there is more to the story than just numbers? You are not alone in wanting to know what the market might be missing.
- Recently, Novo Nordisk’s share price has swung notably, dropping 3.8% this past week and down 7.4% over the last month, contributing to a hefty 41.3% decline year to date.
- These moves came amid evolving global headlines about the pharmaceutical industry, including shifts in healthcare policy and increased competition in the diabetes care space. Such news has left investors wondering whether these risks are now reflected in the current stock price or if an opportunity is emerging.
- When you run Novo Nordisk through our checklist of six key valuation metrics, the company scores a 5 out of 6 for being undervalued, which is a solid mark that is worth exploring further. Next, we will look at the different valuation approaches investors use, and by the end, uncover a method that could provide even greater insight into Novo Nordisk’s real worth.
Find out why Novo Nordisk's -53.7% return over the last year is lagging behind its peers.
Approach 1: Novo Nordisk Discounted Cash Flow (DCF) Analysis
The Discounted Cash Flow (DCF) model estimates a company’s true worth by forecasting its future cash flows and then discounting those amounts back to today’s value. This effectively shows what investors should be willing to pay for those future flows in today’s money.
For Novo Nordisk, the current trailing twelve month Free Cash Flow stands at 68.4 Billion DKK. Analysts project strong growth in the years ahead, forecasting Free Cash Flow to reach 135.3 Billion DKK by 2029. Although direct analyst estimates typically cover only the next five years, subsequent cash flow projections are extrapolated to account for ongoing business performance and industry trends.
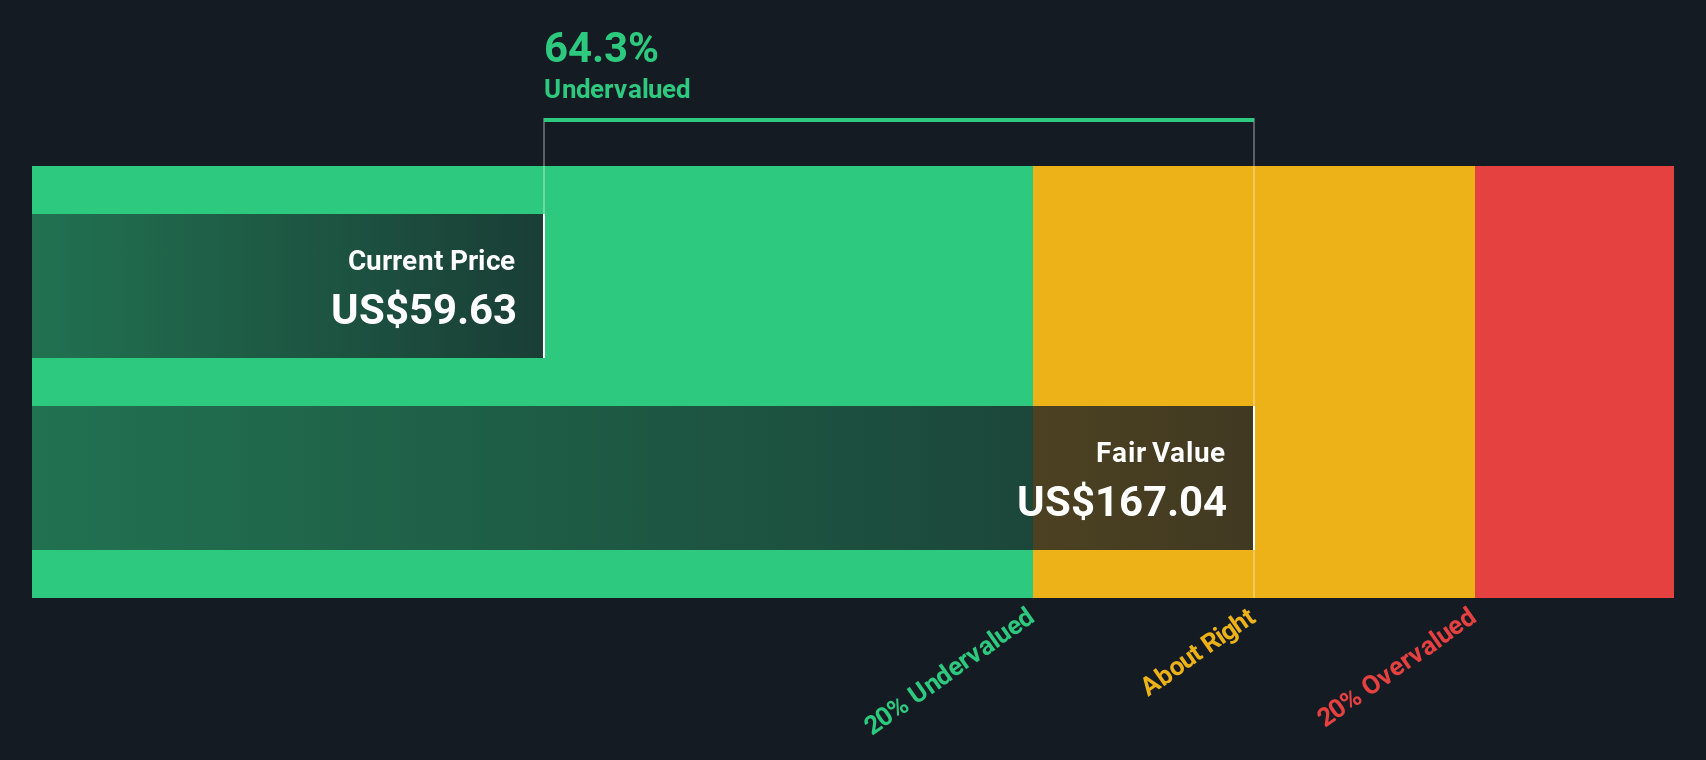
Based on these projections and using the two-stage Free Cash Flow to Equity model, the intrinsic value of Novo Nordisk’s stock comes out to 159.41 DKK per share. Relative to the present market price, this represents a substantial discount of 67.8%. Such a difference suggests the stock is significantly undervalued by the market, offering a potential opportunity for investors seeking value grounded in fundamental analysis.
Result: UNDERVALUED
Our Discounted Cash Flow (DCF) analysis suggests Novo Nordisk is undervalued by 67.8%. Track this in your watchlist or portfolio, or discover 853 more undervalued stocks based on cash flows.
Approach 2: Novo Nordisk Price vs Earnings
The Price-to-Earnings (PE) ratio is one of the most trusted tools for evaluating profitable businesses like Novo Nordisk. This metric measures how much investors are paying for each unit of the company’s earnings, making it especially relevant for companies with consistent profitability and a solid earnings base.
When determining what a “normal” or “fair” PE ratio should be, it is important to remember that higher growth expectations usually justify a higher ratio, while greater perceived risk can pull it down. In essence, the PE ratio reflects both the company’s future potential and the stability of its current earnings.
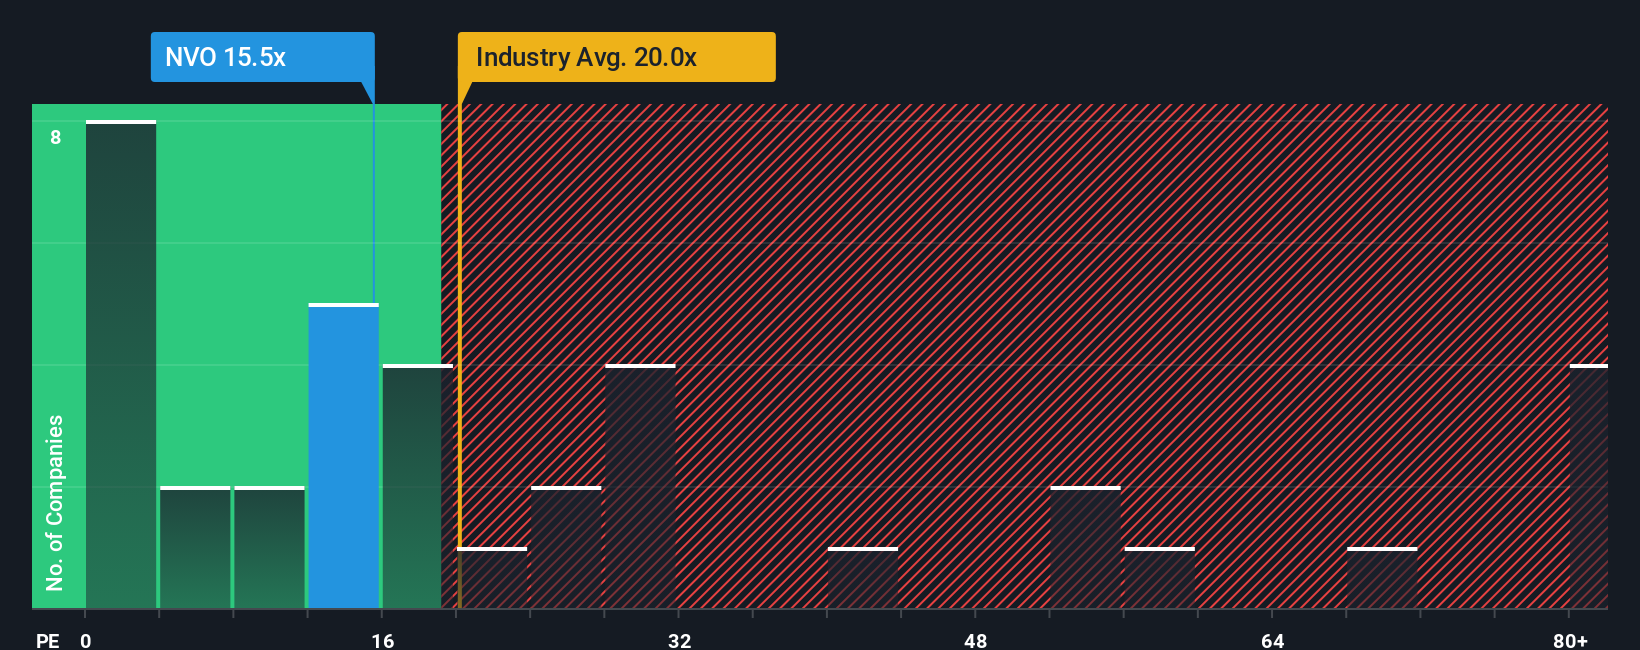
Novo Nordisk currently trades at a PE ratio of 13.4x. For context, the pharmaceutical industry average stands at 17.3x, while its peer group trades at an even higher average of 25.3x. These comparisons might suggest the stock is undervalued, but simple benchmarks can miss nuances that matter to investors.
This is where the Simply Wall St “Fair Ratio” comes in. The Fair Ratio model for Novo Nordisk is 30.7x, calculated by weighing key factors such as the company’s earnings growth, profit margin, industry, market capitalization, and risk profile. Unlike generic industry averages or peer multiples, the Fair Ratio is specifically tailored to the company’s unique circumstances, producing a more precise value indicator.
Comparing Novo Nordisk’s current PE ratio of 13.4x to the Fair Ratio of 30.7x highlights a significant gap, suggesting the stock is trading well below what fundamental factors warrant.
Result: UNDERVALUED
PE ratios tell one story, but what if the real opportunity lies elsewhere? Discover 1394 companies where insiders are betting big on explosive growth.
Upgrade Your Decision Making: Choose your Novo Nordisk Narrative
Earlier we mentioned that there is an even better way to understand valuation, so let us introduce you to Narratives, an innovative approach that empowers you to link Novo Nordisk’s business story with your own financial forecasts and estimate of fair value.
A Narrative is more than just a number; it is your perspective on how you think the company will perform, grounded in your assumptions about future revenue, margins, and earnings. Narratives bridge the gap between headline figures and the story behind them by helping you connect your expectations with a data-driven outlook. This results in a fair value that reflects your unique view.
Narratives are easy to create and share on the Simply Wall St platform, within the Community page that is used by millions of investors. This tool lets you evaluate whether to buy or sell by directly comparing your calculated Fair Value to the current market Price. Best of all, Narratives stay up to date as new information such as news or earnings releases comes in, so your investment thesis dynamically evolves with the company.
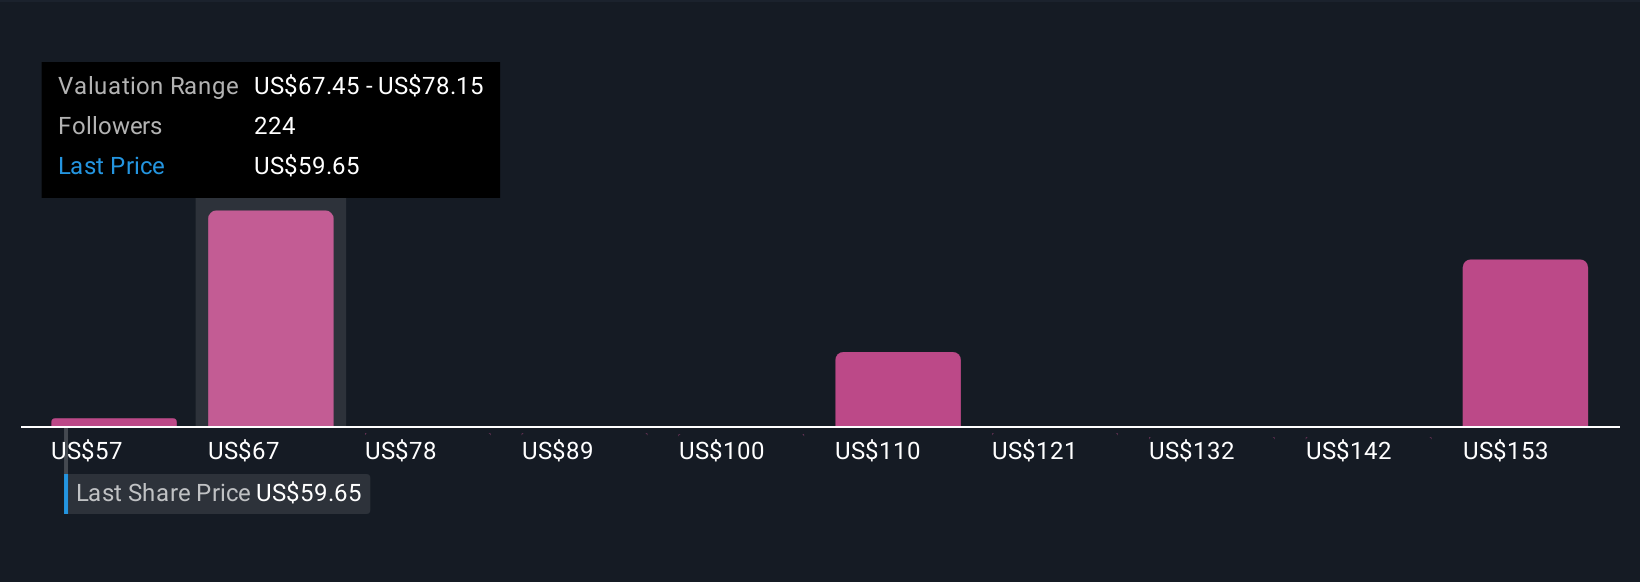
For example, some investors see Novo Nordisk's pipeline as a game changer and set a fair value of $160 per ADR, while others focus on risks and set theirs at $70. This gives you real-world insight into how different perspectives shape investment decisions.
Do you think there's more to the story for Novo Nordisk? Head over to our Community to see what others are saying!
This article by Simply Wall St is general in nature. We provide commentary based on historical data and analyst forecasts only using an unbiased methodology and our articles are not intended to be financial advice. It does not constitute a recommendation to buy or sell any stock, and does not take account of your objectives, or your financial situation. We aim to bring you long-term focused analysis driven by fundamental data. Note that our analysis may not factor in the latest price-sensitive company announcements or qualitative material. Simply Wall St has no position in any stocks mentioned.
Valuation is complex, but we're here to simplify it.
Discover if Novo Nordisk might be undervalued or overvalued with our detailed analysis, featuring fair value estimates, potential risks, dividends, insider trades, and its financial condition.
Access Free AnalysisHave feedback on this article? Concerned about the content? Get in touch with us directly. Alternatively, email editorial-team@simplywallst.com
About NYSE:NVO
Novo Nordisk
Engages in the research and development, manufacture, and distribution of pharmaceutical products in Europe, the Middle East, Africa, Mainland China, Hong Kong, Taiwan, North America, and internationally.
Undervalued with solid track record and pays a dividend.
Similar Companies
Market Insights

Advertisement
Community Narratives
The company that turned a verb into a global necessity and basically runs the modern internet, digital ads, smartphones, maps, and AI.
Fair Value US$300.00|8.5% undervalued
OS
Community Contributor
Flowers Foods Pays A Fair Price For Health
Fair Value US$16.12|24.6% undervalued
NV
Community Contributor
TMX Group will thrive with 33.3% profit margin and enduring market moat
Fair Value CA$49.90|0.1% undervalued
LI
Community Contributor