
Advertisement
- United States
- /
- Biotech
- /
- NasdaqCM:VRDN
Is There An Opportunity With Viridian Therapeutics, Inc.'s (NASDAQ:VRDN) 44% Undervaluation?
Key Insights
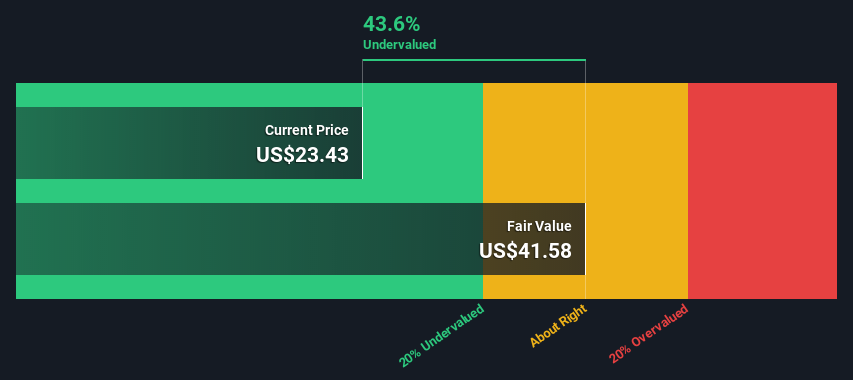
- The projected fair value for Viridian Therapeutics is US$41.58 based on 2 Stage Free Cash Flow to Equity
- Viridian Therapeutics' US$23.43 share price signals that it might be 44% undervalued
- Our fair value estimate is 10% lower than Viridian Therapeutics' analyst price target of US$46.43
Today we will run through one way of estimating the intrinsic value of Viridian Therapeutics, Inc. (NASDAQ:VRDN) by projecting its future cash flows and then discounting them to today's value. We will use the Discounted Cash Flow (DCF) model on this occasion. Don't get put off by the jargon, the math behind it is actually quite straightforward.
We generally believe that a company's value is the present value of all of the cash it will generate in the future. However, a DCF is just one valuation metric among many, and it is not without flaws. If you want to learn more about discounted cash flow, the rationale behind this calculation can be read in detail in the Simply Wall St analysis model.
View our latest analysis for Viridian Therapeutics
What's The Estimated Valuation?
We are going to use a two-stage DCF model, which, as the name states, takes into account two stages of growth. The first stage is generally a higher growth period which levels off heading towards the terminal value, captured in the second 'steady growth' period. To begin with, we have to get estimates of the next ten years of cash flows. Where possible we use analyst estimates, but when these aren't available we extrapolate the previous free cash flow (FCF) from the last estimate or reported value. We assume companies with shrinking free cash flow will slow their rate of shrinkage, and that companies with growing free cash flow will see their growth rate slow, over this period. We do this to reflect that growth tends to slow more in the early years than it does in later years.
A DCF is all about the idea that a dollar in the future is less valuable than a dollar today, so we discount the value of these future cash flows to their estimated value in today's dollars:
10-year free cash flow (FCF) forecast
| 2023 | 2024 | 2025 | 2026 | 2027 | 2028 | 2029 | 2030 | 2031 | 2032 | |
| Levered FCF ($, Millions) | -US$159.3m | -US$157.3m | -US$138.0m | -US$100.5m | US$57.0m | US$81.4m | US$106.2m | US$129.6m | US$150.4m | US$168.3m |
| Growth Rate Estimate Source | Analyst x5 | Analyst x5 | Analyst x5 | Analyst x4 | Analyst x4 | Est @ 42.74% | Est @ 30.55% | Est @ 22.02% | Est @ 16.05% | Est @ 11.87% |
| Present Value ($, Millions) Discounted @ 6.9% | -US$149 | -US$138 | -US$113 | -US$77.1 | US$40.9 | US$54.6 | US$66.8 | US$76.2 | US$82.8 | US$86.7 |
("Est" = FCF growth rate estimated by Simply Wall St)
Present Value of 10-year Cash Flow (PVCF) = -US$69m
The second stage is also known as Terminal Value, this is the business's cash flow after the first stage. For a number of reasons a very conservative growth rate is used that cannot exceed that of a country's GDP growth. In this case we have used the 5-year average of the 10-year government bond yield (2.1%) to estimate future growth. In the same way as with the 10-year 'growth' period, we discount future cash flows to today's value, using a cost of equity of 6.9%.
Terminal Value (TV)= FCF2032 × (1 + g) ÷ (r – g) = US$168m× (1 + 2.1%) ÷ (6.9%– 2.1%) = US$3.6b
Present Value of Terminal Value (PVTV)= TV / (1 + r)10= US$3.6b÷ ( 1 + 6.9%)10= US$1.9b
The total value, or equity value, is then the sum of the present value of the future cash flows, which in this case is US$1.8b. To get the intrinsic value per share, we divide this by the total number of shares outstanding. Relative to the current share price of US$23.4, the company appears quite good value at a 44% discount to where the stock price trades currently. The assumptions in any calculation have a big impact on the valuation, so it is better to view this as a rough estimate, not precise down to the last cent.
The Assumptions
Now the most important inputs to a discounted cash flow are the discount rate, and of course, the actual cash flows. You don't have to agree with these inputs, I recommend redoing the calculations yourself and playing with them. The DCF also does not consider the possible cyclicality of an industry, or a company's future capital requirements, so it does not give a full picture of a company's potential performance. Given that we are looking at Viridian Therapeutics as potential shareholders, the cost of equity is used as the discount rate, rather than the cost of capital (or weighted average cost of capital, WACC) which accounts for debt. In this calculation we've used 6.9%, which is based on a levered beta of 0.800. Beta is a measure of a stock's volatility, compared to the market as a whole. We get our beta from the industry average beta of globally comparable companies, with an imposed limit between 0.8 and 2.0, which is a reasonable range for a stable business.
SWOT Analysis for Viridian Therapeutics
Strength
- Debt is well covered by earnings.
Weakness
- Shareholders have been diluted in the past year.
Opportunity
- Has sufficient cash runway for more than 3 years based on current free cash flows.
- Trading below our estimate of fair value by more than 20%.
- Significant insider buying over the past 3 months.
Threat
- Debt is not well covered by operating cash flow.
- Not expected to become profitable over the next 3 years.
Moving On:
Whilst important, the DCF calculation is only one of many factors that you need to assess for a company. DCF models are not the be-all and end-all of investment valuation. Preferably you'd apply different cases and assumptions and see how they would impact the company's valuation. If a company grows at a different rate, or if its cost of equity or risk free rate changes sharply, the output can look very different. Can we work out why the company is trading at a discount to intrinsic value? For Viridian Therapeutics, we've put together three relevant elements you should further research:
- Risks: Case in point, we've spotted 3 warning signs for Viridian Therapeutics you should be aware of, and 1 of them is a bit unpleasant.
- Management:Have insiders been ramping up their shares to take advantage of the market's sentiment for VRDN's future outlook? Check out our management and board analysis with insights on CEO compensation and governance factors.
- Other High Quality Alternatives: Do you like a good all-rounder? Explore our interactive list of high quality stocks to get an idea of what else is out there you may be missing!
PS. Simply Wall St updates its DCF calculation for every American stock every day, so if you want to find the intrinsic value of any other stock just search here.
New: Manage All Your Stock Portfolios in One Place
We've created the ultimate portfolio companion for stock investors, and it's free.
• Connect an unlimited number of Portfolios and see your total in one currency
• Be alerted to new Warning Signs or Risks via email or mobile
• Track the Fair Value of your stocks
Have feedback on this article? Concerned about the content? Get in touch with us directly. Alternatively, email editorial-team (at) simplywallst.com.
This article by Simply Wall St is general in nature. We provide commentary based on historical data and analyst forecasts only using an unbiased methodology and our articles are not intended to be financial advice. It does not constitute a recommendation to buy or sell any stock, and does not take account of your objectives, or your financial situation. We aim to bring you long-term focused analysis driven by fundamental data. Note that our analysis may not factor in the latest price-sensitive company announcements or qualitative material. Simply Wall St has no position in any stocks mentioned.
About NasdaqCM:VRDN
Viridian Therapeutics
Engages in discovering, developing, and commercializing treatments for serious and rare diseases.
Excellent balance sheet and slightly overvalued.
Market Insights


Advertisement
Community Narratives
The Next Phase of Energy Storage: How NeoVolta Is Tackling America’s Power Crunch
Fair Value US$7.50|39.3% undervalued
MA
Community Contributor
Why EnSilica is Worth Possibly 13x its Current Price
Fair Value UK£5.00|91.8% undervalued
DO
Community Contributor
A case for Cassiar Gold Corp (TSXV: GLDC) to reach CAD$8-10 before 2030 (X30-37)
Fair Value CA$10.00|97.4% undervalued
AG
Community Contributor
M&A Activity, Industry Diversification & A Defense Contract Monopoly Will Push BWXT For Healthy Long-Term Growth
Fair Value US$220.00|17.3% undervalued
CL
Community Contributor