
Some say volatility, rather than debt, is the best way to think about risk as an investor, but Warren Buffett famously said that 'Volatility is far from synonymous with risk.' So it seems the smart money knows that debt - which is usually involved in bankruptcies - is a very important factor, when you assess how risky a company is. As with many other companies Societal CDMO, Inc. (NASDAQ:SCTL) makes use of debt. But the real question is whether this debt is making the company risky.
Why Does Debt Bring Risk?
Debt assists a business until the business has trouble paying it off, either with new capital or with free cash flow. In the worst case scenario, a company can go bankrupt if it cannot pay its creditors. However, a more frequent (but still costly) occurrence is where a company must issue shares at bargain-basement prices, permanently diluting shareholders, just to shore up its balance sheet. Of course, the upside of debt is that it often represents cheap capital, especially when it replaces dilution in a company with the ability to reinvest at high rates of return. The first thing to do when considering how much debt a business uses is to look at its cash and debt together.
Check out our latest analysis for Societal CDMO
How Much Debt Does Societal CDMO Carry?
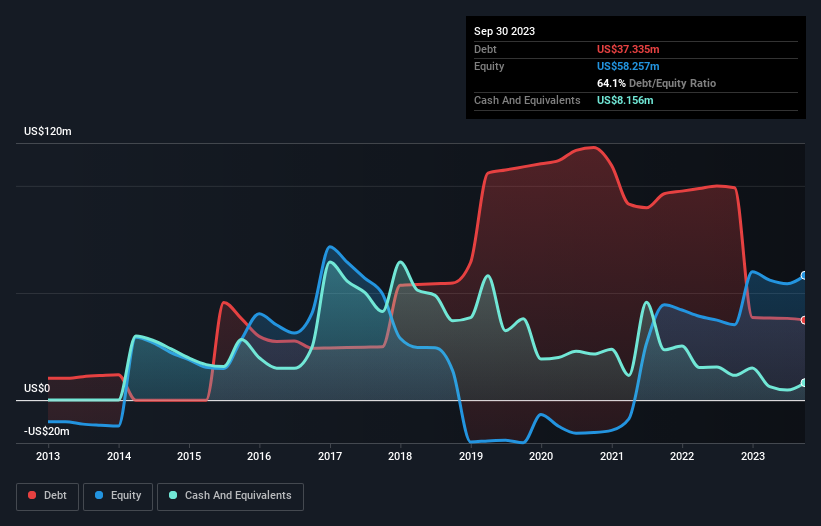
As you can see below, Societal CDMO had US$37.3m of debt at September 2023, down from US$99.2m a year prior. However, because it has a cash reserve of US$8.16m, its net debt is less, at about US$29.2m.
How Strong Is Societal CDMO's Balance Sheet?
The latest balance sheet data shows that Societal CDMO had liabilities of US$21.6m due within a year, and liabilities of US$71.7m falling due after that. On the other hand, it had cash of US$8.16m and US$24.8m worth of receivables due within a year. So it has liabilities totalling US$60.3m more than its cash and near-term receivables, combined.
This deficit casts a shadow over the US$33.5m company, like a colossus towering over mere mortals. So we'd watch its balance sheet closely, without a doubt. After all, Societal CDMO would likely require a major re-capitalisation if it had to pay its creditors today. When analysing debt levels, the balance sheet is the obvious place to start. But ultimately the future profitability of the business will decide if Societal CDMO can strengthen its balance sheet over time. So if you're focused on the future you can check out this free report showing analyst profit forecasts.
Over 12 months, Societal CDMO reported revenue of US$91m, which is a gain of 3.4%, although it did not report any earnings before interest and tax. That rate of growth is a bit slow for our taste, but it takes all types to make a world.
Caveat Emptor
Importantly, Societal CDMO had an earnings before interest and tax (EBIT) loss over the last year. Its EBIT loss was a whopping US$3.7m. Considering that alongside the liabilities mentioned above make us nervous about the company. It would need to improve its operations quickly for us to be interested in it. Not least because it had negative free cash flow of US$11m over the last twelve months. So suffice it to say we consider the stock to be risky. There's no doubt that we learn most about debt from the balance sheet. But ultimately, every company can contain risks that exist outside of the balance sheet. To that end, you should be aware of the 4 warning signs we've spotted with Societal CDMO .
If you're interested in investing in businesses that can grow profits without the burden of debt, then check out this free list of growing businesses that have net cash on the balance sheet.
Mobile Infrastructure for Defense and Disaster
The next wave in robotics isn't humanoid. Its fully autonomous towers delivering 5G, ISR, and radar in under 30 minutes, anywhere.
Get the investor briefing before the next round of contracts
Sponsored On Behalf of CiTechNew: Manage All Your Stock Portfolios in One Place
We've created the ultimate portfolio companion for stock investors, and it's free.
• Connect an unlimited number of Portfolios and see your total in one currency
• Be alerted to new Warning Signs or Risks via email or mobile
• Track the Fair Value of your stocks
Have feedback on this article? Concerned about the content? Get in touch with us directly. Alternatively, email editorial-team (at) simplywallst.com.
This article by Simply Wall St is general in nature. We provide commentary based on historical data and analyst forecasts only using an unbiased methodology and our articles are not intended to be financial advice. It does not constitute a recommendation to buy or sell any stock, and does not take account of your objectives, or your financial situation. We aim to bring you long-term focused analysis driven by fundamental data. Note that our analysis may not factor in the latest price-sensitive company announcements or qualitative material. Simply Wall St has no position in any stocks mentioned.
About NasdaqCM:SCTL
Societal CDMO
Societal CDMO, Inc., a contract development and manufacturing organization, engages in the research and development, manufacturing, and packaging for various therapeutic dosage forms primarily in the small molecules in the United States and internationally.
Fair value with mediocre balance sheet.
Similar Companies
Market Insights

Weekly Picks

Early mover in a fast growing industry. Likely to experience share price volatility as they scale


A case for CA$31.80 (undiluted), aka 8,616% upside from CA$0.37 (an 86 bagger!).


Moderation and Stabilisation: HOLD: Fair Price based on a 4-year Cycle is $12.08
Recently Updated Narratives

Airbnb Stock: Platform Growth in a World of Saturation and Scrutiny

Adobe Stock: AI-Fueled ARR Growth Pushes Guidance Higher, But Cost Pressures Loom

Thomson Reuters Stock: When Legal Intelligence Becomes Mission-Critical Infrastructure
Popular Narratives


Crazy Undervalued 42 Baggers Silver Play (Active & Running Mine)


NVDA: Expanding AI Demand Will Drive Major Data Center Investments Through 2026

The AI Infrastructure Giant Grows Into Its Valuation
Trending Discussion


