Avidity Biosciences (RNA) has delivered a strong showing in recent months, with shares nearly doubling over the past quarter. The company’s momentum has sparked new interest among investors looking for growth within the biotech sector.
Momentum has only accelerated for Avidity Biosciences lately, with its share price climbing over 63% in the past month and notching an impressive 123% year-to-date share price return. While the one-year total shareholder return of 61% trails these more recent gains, the surge suggests fresh optimism around Avidity’s growth story and a shift in how the market is assessing its long-term prospects.
If you’re interested in what other innovative healthcare names have been gaining ground, now is a great time to explore new possibilities using our curated list: See the full list for free.
Given the rapid rally and improving fundamentals, investors must ask whether Avidity Biosciences is still trading at an attractive valuation or if the recent surge is a sign that markets are already factoring in much of its potential growth.
Advertisement
Price-to-Book of 8.4x: Is it justified?
Avidity Biosciences is currently trading with a price-to-book ratio of 8.4x, significantly higher than both its biotech industry peers and its own historical levels. At a last close price of $69.65, the company’s valuation sits well above typical sector multiples, bringing into question whether this premium is warranted.
The price-to-book ratio measures how much investors are willing to pay for each dollar of net assets. In the biotech sector, investors often tolerate elevated multiples if a company shows the potential for high growth and valuable intellectual property, even if short-term earnings remain negative.
For Avidity, this premium suggests the market expects exceptional future progress, but the comparison is stark. The average price-to-book ratio in the US biotechs sector is only 2.5x, and Avidity even outpaces its closest peers, which average 7.6x. This implies that market enthusiasm is running ahead of fundamentals. If the fair ratio were available, it could reveal just how stretched this multiple is, potentially offering a benchmark for where the valuation could settle if expectations shift.
However, slowed revenue growth or a failure to meet analyst targets could challenge the current optimism and prompt a reevaluation of Avidity's elevated valuation.
Another View: SWS DCF Model Paints a Different Picture
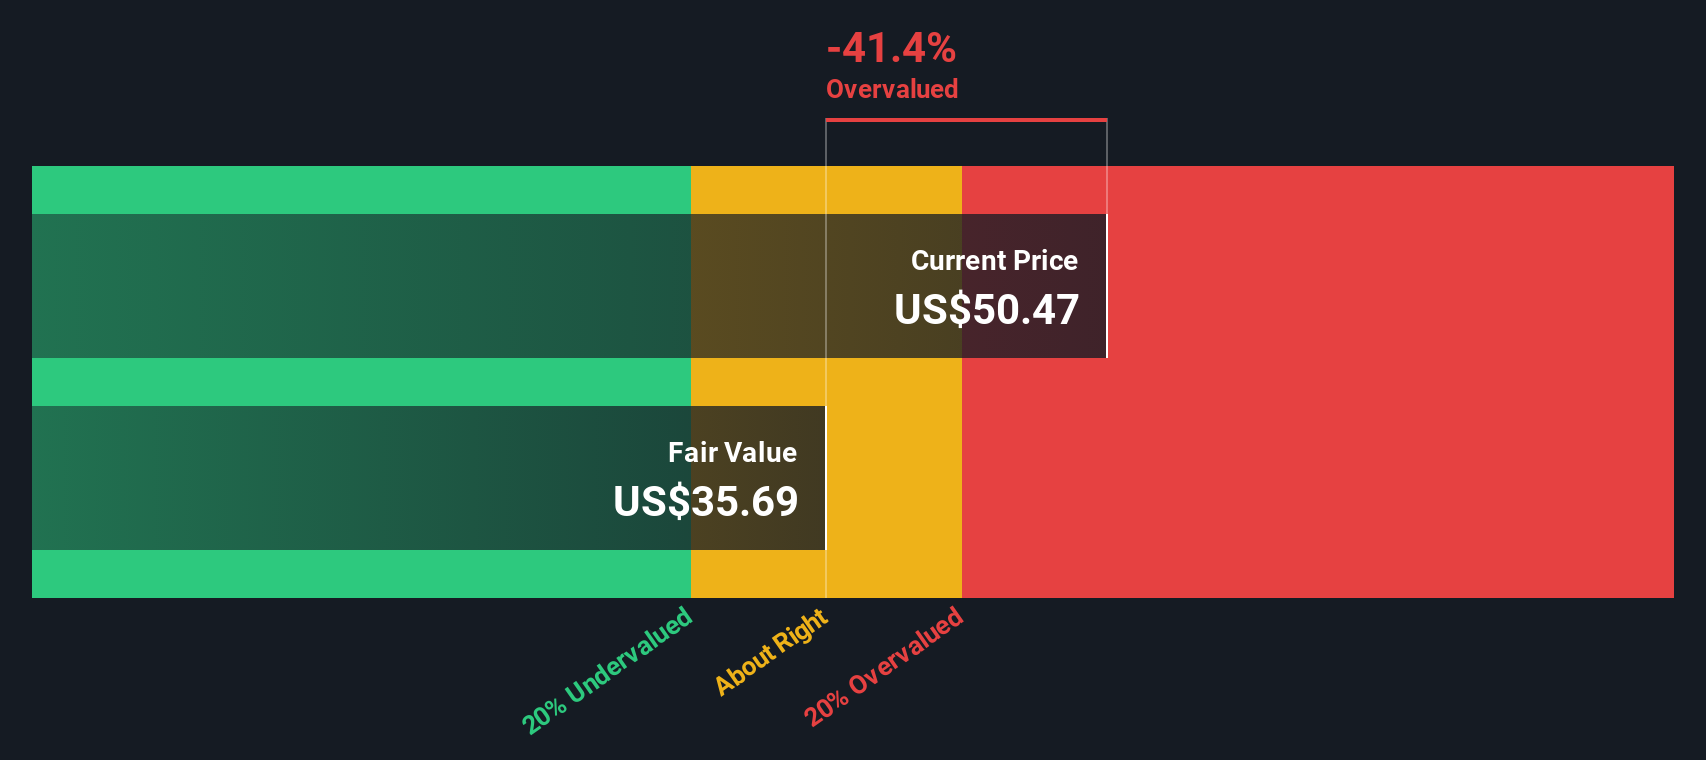
Looking through the lens of our Discounted Cash Flow (DCF) model, Avidity Biosciences appears significantly overvalued. According to the SWS DCF model, the fair value estimate sits at $35.22 per share, which is well below the current market price. This sharp disparity raises the question: is the market too optimistic, or is the DCF approach overlooking some upside?
If you’d rather draw your own conclusions or want to dig deeper into the data yourself, you can put together a custom narrative in just a few minutes with Do it your way.
A great starting point for your Avidity Biosciences research is our analysis highlighting 1 key reward and 3 important warning signs that could impact your investment decision.
Looking for more smart investing opportunities?
Don't let your next winning stock slip through your fingers. The Simply Wall St Screener is packed with unique, actionable ideas you can use right now.
Maximize your potential returns with steady income by reviewing these 21 dividend stocks with yields > 3%, which consistently deliver strong yields over 3% every year.
Stay ahead in the tech race by assessing these 26 AI penny stocks, which are shaking up industries with the latest advances in artificial intelligence and automation.
This article by Simply Wall St is general in nature. We provide commentary based on historical data
and analyst forecasts only using an unbiased methodology and our articles are not intended to be financial advice. It does not constitute a recommendation to buy or sell any stock, and does not take account of your objectives, or your
financial situation. We aim to bring you long-term focused analysis driven by fundamental data.
Note that our analysis may not factor in the latest price-sensitive company announcements or qualitative material.
Simply Wall St has no position in any stocks mentioned.
New: Manage All Your Stock Portfolios in One Place
We've created the ultimate portfolio companion for stock investors, and it's free.
• Connect an unlimited number of Portfolios and see your total in one currency • Be alerted to new Warning Signs or Risks via email or mobile • Track the Fair Value of your stocks