
Advertisement
Legendary fund manager Li Lu (who Charlie Munger backed) once said, 'The biggest investment risk is not the volatility of prices, but whether you will suffer a permanent loss of capital.' When we think about how risky a company is, we always like to look at its use of debt, since debt overload can lead to ruin. We note that MiMedx Group, Inc. (NASDAQ:MDXG) does have debt on its balance sheet. But the more important question is: how much risk is that debt creating?
Why Does Debt Bring Risk?
Generally speaking, debt only becomes a real problem when a company can't easily pay it off, either by raising capital or with its own cash flow. Part and parcel of capitalism is the process of 'creative destruction' where failed businesses are mercilessly liquidated by their bankers. While that is not too common, we often do see indebted companies permanently diluting shareholders because lenders force them to raise capital at a distressed price. Of course, debt can be an important tool in businesses, particularly capital heavy businesses. When we examine debt levels, we first consider both cash and debt levels, together.
How Much Debt Does MiMedx Group Carry?
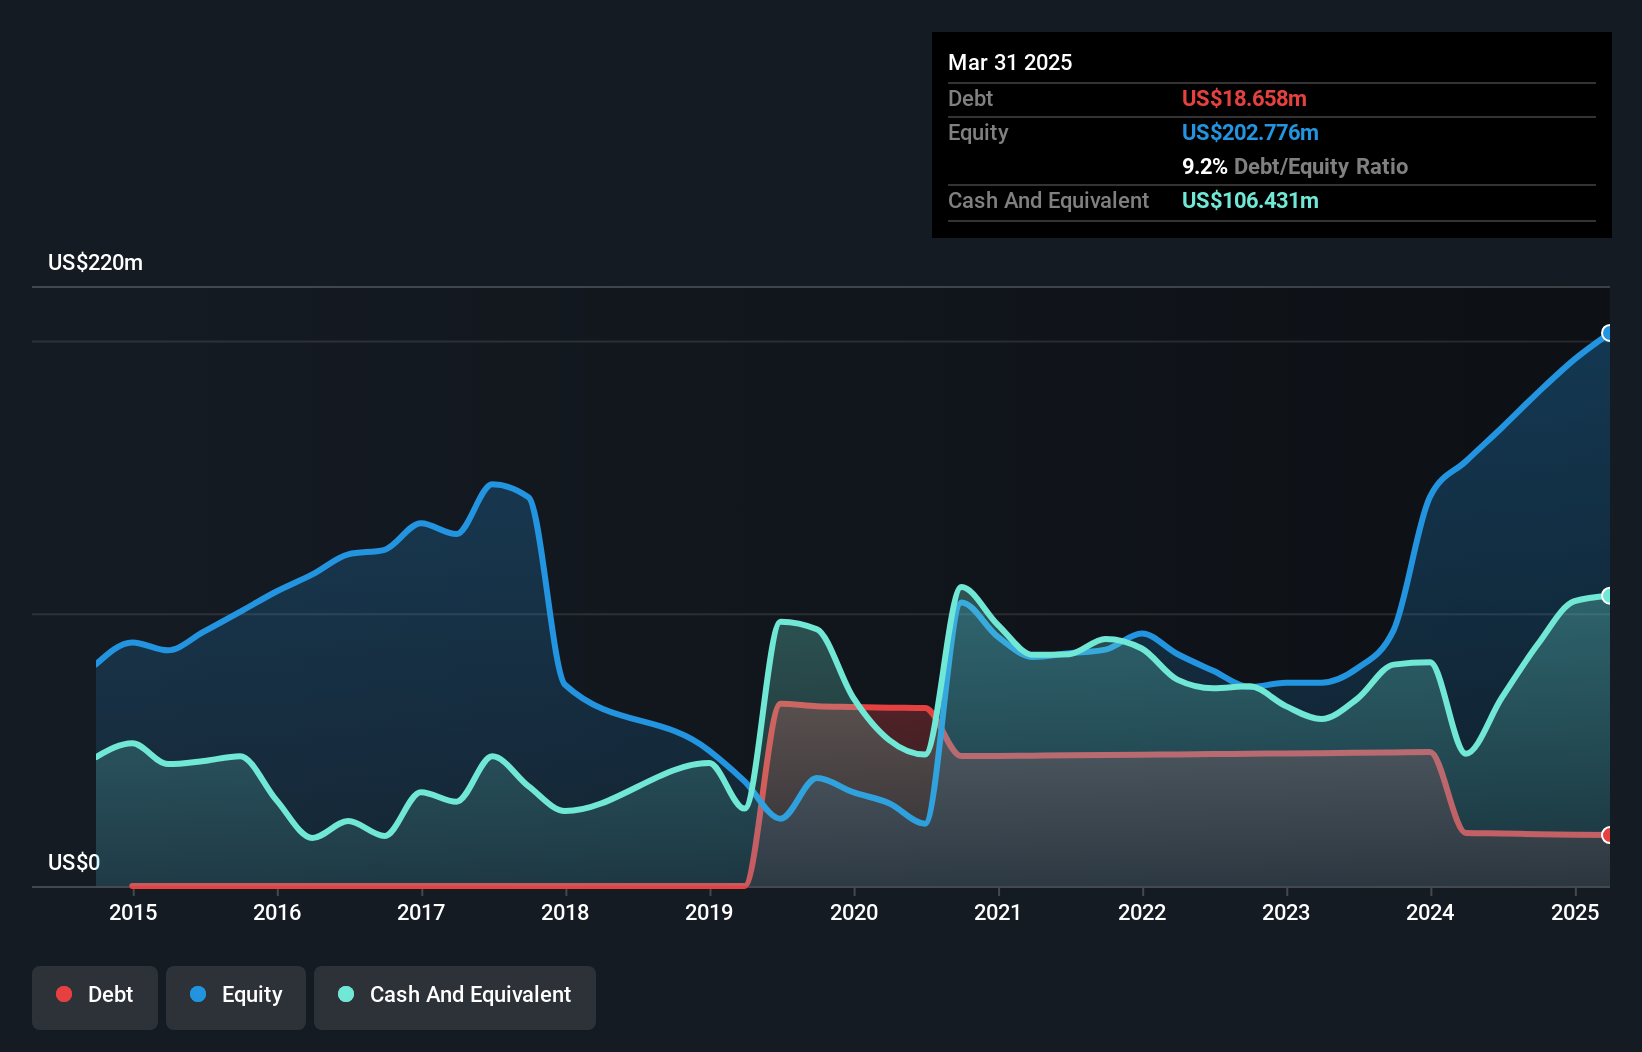
The image below, which you can click on for greater detail, shows that MiMedx Group had debt of US$18.7m at the end of March 2025, a reduction from US$19.5m over a year. However, its balance sheet shows it holds US$106.4m in cash, so it actually has US$87.8m net cash.
How Healthy Is MiMedx Group's Balance Sheet?
The latest balance sheet data shows that MiMedx Group had liabilities of US$42.6m due within a year, and liabilities of US$25.0m falling due after that. Offsetting this, it had US$106.4m in cash and US$62.3m in receivables that were due within 12 months. So it actually has US$101.1m more liquid assets than total liabilities.
This short term liquidity is a sign that MiMedx Group could probably pay off its debt with ease, as its balance sheet is far from stretched. Simply put, the fact that MiMedx Group has more cash than debt is arguably a good indication that it can manage its debt safely.
See our latest analysis for MiMedx Group
Fortunately, MiMedx Group grew its EBIT by 7.1% in the last year, making that debt load look even more manageable. When analysing debt levels, the balance sheet is the obvious place to start. But it is future earnings, more than anything, that will determine MiMedx Group's ability to maintain a healthy balance sheet going forward. So if you're focused on the future you can check out this free report showing analyst profit forecasts.
But our final consideration is also important, because a company cannot pay debt with paper profits; it needs cold hard cash. While MiMedx Group has net cash on its balance sheet, it's still worth taking a look at its ability to convert earnings before interest and tax (EBIT) to free cash flow, to help us understand how quickly it is building (or eroding) that cash balance. During the last two years, MiMedx Group generated free cash flow amounting to a very robust 94% of its EBIT, more than we'd expect. That puts it in a very strong position to pay down debt.
Summing Up
While we empathize with investors who find debt concerning, you should keep in mind that MiMedx Group has net cash of US$87.8m, as well as more liquid assets than liabilities. And it impressed us with free cash flow of US$64m, being 94% of its EBIT. So we don't think MiMedx Group's use of debt is risky. The balance sheet is clearly the area to focus on when you are analysing debt. But ultimately, every company can contain risks that exist outside of the balance sheet. We've identified 1 warning sign with MiMedx Group , and understanding them should be part of your investment process.
At the end of the day, it's often better to focus on companies that are free from net debt. You can access our special list of such companies (all with a track record of profit growth). It's free.
New: Manage All Your Stock Portfolios in One Place
We've created the ultimate portfolio companion for stock investors, and it's free.
• Connect an unlimited number of Portfolios and see your total in one currency
• Be alerted to new Warning Signs or Risks via email or mobile
• Track the Fair Value of your stocks
Have feedback on this article? Concerned about the content? Get in touch with us directly. Alternatively, email editorial-team (at) simplywallst.com.
This article by Simply Wall St is general in nature. We provide commentary based on historical data and analyst forecasts only using an unbiased methodology and our articles are not intended to be financial advice. It does not constitute a recommendation to buy or sell any stock, and does not take account of your objectives, or your financial situation. We aim to bring you long-term focused analysis driven by fundamental data. Note that our analysis may not factor in the latest price-sensitive company announcements or qualitative material. Simply Wall St has no position in any stocks mentioned.
About NasdaqCM:MDXG
MiMedx Group
Develops and distributes placental tissue allografts for various sectors of healthcare.
Flawless balance sheet and good value.
Similar Companies
Market Insights

Advertisement
Community Narratives
MicroVision will explode future revenue by 380.37% with a vision towards success
Fair Value US$60.00|98.4% undervalued
TH
Community Contributor
The Indispensable Artery for a New North American Economy
Fair Value CA$132.87|1.3% undervalued
TI
Community Contributor