Advertisement
- United States
- /
- Biotech
- /
- NasdaqCM:CELC
Does Celcuity (NASDAQ:CELC) Have A Healthy Balance Sheet?
Legendary fund manager Li Lu (who Charlie Munger backed) once said, 'The biggest investment risk is not the volatility of prices, but whether you will suffer a permanent loss of capital.' So it seems the smart money knows that debt - which is usually involved in bankruptcies - is a very important factor, when you assess how risky a company is. We note that Celcuity Inc. (NASDAQ:CELC) does have debt on its balance sheet. But the real question is whether this debt is making the company risky.
When Is Debt A Problem?
Debt assists a business until the business has trouble paying it off, either with new capital or with free cash flow. Ultimately, if the company can't fulfill its legal obligations to repay debt, shareholders could walk away with nothing. However, a more common (but still painful) scenario is that it has to raise new equity capital at a low price, thus permanently diluting shareholders. Of course, plenty of companies use debt to fund growth, without any negative consequences. When we examine debt levels, we first consider both cash and debt levels, together.
Check out our latest analysis for Celcuity
What Is Celcuity's Debt?
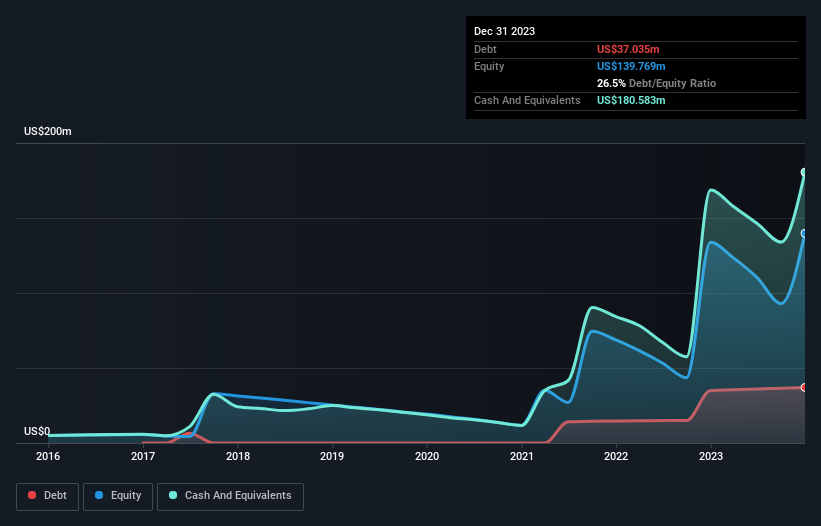
As you can see below, at the end of December 2023, Celcuity had US$37.0m of debt, up from US$35.0m a year ago. Click the image for more detail. However, it does have US$180.6m in cash offsetting this, leading to net cash of US$143.5m.
How Healthy Is Celcuity's Balance Sheet?
We can see from the most recent balance sheet that Celcuity had liabilities of US$14.2m falling due within a year, and liabilities of US$37.3m due beyond that. Offsetting these obligations, it had cash of US$180.6m as well as receivables valued at US$38.3k due within 12 months. So it actually has US$129.2m more liquid assets than total liabilities.
It's good to see that Celcuity has plenty of liquidity on its balance sheet, suggesting conservative management of liabilities. Given it has easily adequate short term liquidity, we don't think it will have any issues with its lenders. Succinctly put, Celcuity boasts net cash, so it's fair to say it does not have a heavy debt load! The balance sheet is clearly the area to focus on when you are analysing debt. But ultimately the future profitability of the business will decide if Celcuity can strengthen its balance sheet over time. So if you want to see what the professionals think, you might find this free report on analyst profit forecasts to be interesting.
Since Celcuity doesn't have significant operating revenue, shareholders may be hoping it comes up with a great new product, before it runs out of money.
So How Risky Is Celcuity?
We have no doubt that loss making companies are, in general, riskier than profitable ones. And we do note that Celcuity had an earnings before interest and tax (EBIT) loss, over the last year. Indeed, in that time it burnt through US$54m of cash and made a loss of US$64m. But the saving grace is the US$143.5m on the balance sheet. That means it could keep spending at its current rate for more than two years. Overall, its balance sheet doesn't seem overly risky, at the moment, but we're always cautious until we see the positive free cash flow. When analysing debt levels, the balance sheet is the obvious place to start. However, not all investment risk resides within the balance sheet - far from it. For example Celcuity has 3 warning signs (and 1 which can't be ignored) we think you should know about.
At the end of the day, it's often better to focus on companies that are free from net debt. You can access our special list of such companies (all with a track record of profit growth). It's free.
New: AI Stock Screener & Alerts
Our new AI Stock Screener scans the market every day to uncover opportunities.
• Dividend Powerhouses (3%+ Yield)
• Undervalued Small Caps with Insider Buying
• High growth Tech and AI Companies
Or build your own from over 50 metrics.
Have feedback on this article? Concerned about the content? Get in touch with us directly. Alternatively, email editorial-team (at) simplywallst.com.
This article by Simply Wall St is general in nature. We provide commentary based on historical data and analyst forecasts only using an unbiased methodology and our articles are not intended to be financial advice. It does not constitute a recommendation to buy or sell any stock, and does not take account of your objectives, or your financial situation. We aim to bring you long-term focused analysis driven by fundamental data. Note that our analysis may not factor in the latest price-sensitive company announcements or qualitative material. Simply Wall St has no position in any stocks mentioned.
About NasdaqCM:CELC
Celcuity
A clinical-stage biotechnology company, focuses on the development of targeted therapies for the treatment of various solid tumors in the United States.
High growth potential with adequate balance sheet.
Market Insights

Advertisement
Weekly Picks
DA


davidlsander on Nevgold ·
The U.S. Government Is Desperate for This Metal. This Tiny Miner Has It -- Its Closest Peer Is Already Worth Double.
Fair Value:US$2.1946.6% undervalued
29 followersusers have followed this narrative
0 commentsusers have commented on this narrative
2 likesusers have liked this narrative
BE

benjamin_lvieq on PayPal Holdings ·
PayPal: PayPal Doesn't Need to Grow – It Needs to Stop Falling – A Mispriced Cash Machine With a Cannibal Buyback
Fair Value:US$6513.0% undervalued
60 followersusers have followed this narrative
2 commentsusers have commented on this narrative
9 likesusers have liked this narrative
JD

JD009 on Celsius Holdings ·
From $5M to $2B: Why the 2024 Crash Was the Best Buying Opportunity in Consumer Stocks
Fair Value:US$55.4347.7% undervalued
20 followersusers have followed this narrative
1 commentusers have commented on this narrative
8 likesusers have liked this narrative
WA

Wavefarer on Accenture ·
High-quality global services company facing an AI-driven valuation reset.
Fair Value:US$30152.3% undervalued
16 followersusers have followed this narrative
1 commentusers have commented on this narrative
5 likesusers have liked this narrative
Recently Updated Narratives
DS

DS2invest on PayPal Holdings ·
PayPal: Undervalued Cash Flow Machine or Value Trap?
Fair Value:US$69.0318.1% undervalued
1 followerusers have followed this narrative
0 commentsusers have commented on this narrative
0 likesusers have liked this narrative
MI


MineStackr on AbraSilver Resource ·
NAV $4B CAD
Fair Value:CA$3661.2% undervalued
1 followerusers have followed this narrative
0 commentsusers have commented on this narrative
0 likesusers have liked this narrative
CE


CentryResearch on Centrus Energy ·
Centrus Energy: The Next Nuclear Bottleneck Isn't Reactors. It's Fuel.
Fair Value:US$19017.9% undervalued
1 followerusers have followed this narrative
0 commentsusers have commented on this narrative
0 likesusers have liked this narrative
Popular Narratives
IN


Investingwilly on Mastercard ·
Mastercard: The Best Dividend Stock You're Ignoring
Fair Value:US$75027.5% undervalued
96 followersusers have followed this narrative
1 commentusers have commented on this narrative
9 likesusers have liked this narrative
BL


BlackGoat on Cerebras Systems ·
The Wafer Giant Threatening NVIDIA's GPU Hegemony
Fair Value:US$415.5458.4% undervalued
63 followersusers have followed this narrative
3 commentsusers have commented on this narrative
11 likesusers have liked this narrative
BE
benjamin_lvieq on PayPal Holdings ·
PayPal: PayPal Doesn't Need to Grow – It Needs to Stop Falling – A Mispriced Cash Machine With a Cannibal Buyback
Fair Value:US$6513.0% undervalued
60 followersusers have followed this narrative
2 commentsusers have commented on this narrative
9 likesusers have liked this narrative
Trending Discussion
BE
benjamin_lvieq on PayPal Holdings ·
An investment case is not about loving the product. Its about price vs reality.
2
|0
ST


StoxEurope on Koninklijke Ahold Delhaize ·
I ran Ahold Delhaize through a three-model triangulation — DCF, dividend discount, and residual inco...
1
|0