
Advertisement
- United States
- /
- Entertainment
- /
- NasdaqGS:TTWO
Estimating The Intrinsic Value Of Take-Two Interactive Software, Inc. (NASDAQ:TTWO)
In this article we are going to estimate the intrinsic value of Take-Two Interactive Software, Inc. (NASDAQ:TTWO) by taking the expected future cash flows and discounting them to today's value. This will be done using the Discounted Cash Flow (DCF) model. Don't get put off by the jargon, the math behind it is actually quite straightforward.
Companies can be valued in a lot of ways, so we would point out that a DCF is not perfect for every situation. If you want to learn more about discounted cash flow, the rationale behind this calculation can be read in detail in the Simply Wall St analysis model.
See our latest analysis for Take-Two Interactive Software
The calculation
We're using the 2-stage growth model, which simply means we take in account two stages of company's growth. In the initial period the company may have a higher growth rate and the second stage is usually assumed to have a stable growth rate. To start off with, we need to estimate the next ten years of cash flows. Where possible we use analyst estimates, but when these aren't available we extrapolate the previous free cash flow (FCF) from the last estimate or reported value. We assume companies with shrinking free cash flow will slow their rate of shrinkage, and that companies with growing free cash flow will see their growth rate slow, over this period. We do this to reflect that growth tends to slow more in the early years than it does in later years.
Generally we assume that a dollar today is more valuable than a dollar in the future, so we discount the value of these future cash flows to their estimated value in today's dollars:
10-year free cash flow (FCF) forecast
| 2022 | 2023 | 2024 | 2025 | 2026 | 2027 | 2028 | 2029 | 2030 | 2031 | |
| Levered FCF ($, Millions) | US$483.9m | US$828.0m | US$1.16b | US$1.06b | US$1.00b | US$974.7m | US$961.9m | US$958.9m | US$962.4m | US$970.7m |
| Growth Rate Estimate Source | Analyst x12 | Analyst x12 | Analyst x5 | Analyst x2 | Analyst x1 | Est @ -2.72% | Est @ -1.31% | Est @ -0.32% | Est @ 0.37% | Est @ 0.86% |
| Present Value ($, Millions) Discounted @ 6.7% | US$454 | US$728 | US$959 | US$815 | US$726 | US$662 | US$612 | US$572 | US$538 | US$509 |
("Est" = FCF growth rate estimated by Simply Wall St)
Present Value of 10-year Cash Flow (PVCF) = US$6.6b
After calculating the present value of future cash flows in the initial 10-year period, we need to calculate the Terminal Value, which accounts for all future cash flows beyond the first stage. The Gordon Growth formula is used to calculate Terminal Value at a future annual growth rate equal to the 5-year average of the 10-year government bond yield of 2.0%. We discount the terminal cash flows to today's value at a cost of equity of 6.7%.
Terminal Value (TV)= FCF2031 × (1 + g) ÷ (r – g) = US$971m× (1 + 2.0%) ÷ (6.7%– 2.0%) = US$21b
Present Value of Terminal Value (PVTV)= TV / (1 + r)10= US$21b÷ ( 1 + 6.7%)10= US$11b
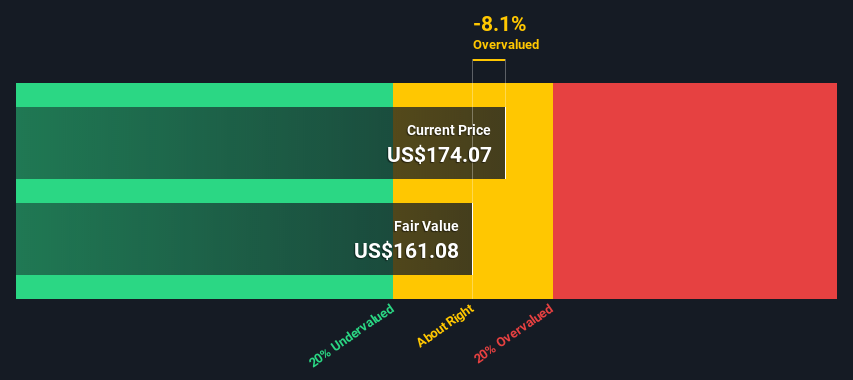
The total value is the sum of cash flows for the next ten years plus the discounted terminal value, which results in the Total Equity Value, which in this case is US$18b. To get the intrinsic value per share, we divide this by the total number of shares outstanding. Compared to the current share price of US$174, the company appears around fair value at the time of writing. The assumptions in any calculation have a big impact on the valuation, so it is better to view this as a rough estimate, not precise down to the last cent.
Important assumptions
Now the most important inputs to a discounted cash flow are the discount rate, and of course, the actual cash flows. If you don't agree with these result, have a go at the calculation yourself and play with the assumptions. The DCF also does not consider the possible cyclicality of an industry, or a company's future capital requirements, so it does not give a full picture of a company's potential performance. Given that we are looking at Take-Two Interactive Software as potential shareholders, the cost of equity is used as the discount rate, rather than the cost of capital (or weighted average cost of capital, WACC) which accounts for debt. In this calculation we've used 6.7%, which is based on a levered beta of 0.991. Beta is a measure of a stock's volatility, compared to the market as a whole. We get our beta from the industry average beta of globally comparable companies, with an imposed limit between 0.8 and 2.0, which is a reasonable range for a stable business.
Next Steps:
Whilst important, the DCF calculation ideally won't be the sole piece of analysis you scrutinize for a company. The DCF model is not a perfect stock valuation tool. Preferably you'd apply different cases and assumptions and see how they would impact the company's valuation. If a company grows at a different rate, or if its cost of equity or risk free rate changes sharply, the output can look very different. For Take-Two Interactive Software, we've compiled three further aspects you should assess:
- Risks: Take risks, for example - Take-Two Interactive Software has 1 warning sign we think you should be aware of.
- Management:Have insiders been ramping up their shares to take advantage of the market's sentiment for TTWO's future outlook? Check out our management and board analysis with insights on CEO compensation and governance factors.
- Other High Quality Alternatives: Do you like a good all-rounder? Explore our interactive list of high quality stocks to get an idea of what else is out there you may be missing!
PS. The Simply Wall St app conducts a discounted cash flow valuation for every stock on the NASDAQGS every day. If you want to find the calculation for other stocks just search here.
If you decide to trade Take-Two Interactive Software, use the lowest-cost* platform that is rated #1 Overall by Barron’s, Interactive Brokers. Trade stocks, options, futures, forex, bonds and funds on 135 markets, all from a single integrated account. Promoted
Valuation is complex, but we're here to simplify it.
Discover if Take-Two Interactive Software might be undervalued or overvalued with our detailed analysis, featuring fair value estimates, potential risks, dividends, insider trades, and its financial condition.
Access Free AnalysisThis article by Simply Wall St is general in nature. It does not constitute a recommendation to buy or sell any stock, and does not take account of your objectives, or your financial situation. We aim to bring you long-term focused analysis driven by fundamental data. Note that our analysis may not factor in the latest price-sensitive company announcements or qualitative material. Simply Wall St has no position in any stocks mentioned.
*Interactive Brokers Rated Lowest Cost Broker by StockBrokers.com Annual Online Review 2020
Have feedback on this article? Concerned about the content? Get in touch with us directly. Alternatively, email editorial-team (at) simplywallst.com.
 mitchell_lawler
The Foxhole
The crowd thinks AI winners will be the labs behind the models. I think an easier pick is hiding in payments, and Stripe just spent US$7 billion proving it.
1
About NasdaqGS:TTWO
Take-Two Interactive Software
Develops, publishes, and markets interactive entertainment solutions for consumers worldwide.
Excellent balance sheet with reasonable growth potential.
Similar Companies
Market Insights

Advertisement
Weekly Picks
RI


Rick_Orford on Starfighters Space ·
The 1960s Fighter Jet That Could Crack Open a $20 Billion Satellite Market
Fair Value:US$519.0% undervalued
38 followersusers have followed this narrative
2 commentsusers have commented on this narrative
7 likesusers have liked this narrative
FU


FundamentalFlow on Vertiv Holdings Co ·
The Short and Long Term Compounder of Liquid Cooling industry.
Fair Value:US$45035.0% undervalued
68 followersusers have followed this narrative
0 commentsusers have commented on this narrative
13 likesusers have liked this narrative
JO


John_Eric on SPX Technologies ·
I Fell in Love With a Data-Center Cooling Stock. Then I Opened the Filings.
Fair Value:US$2037.2% overvalued
32 followersusers have followed this narrative
2 commentsusers have commented on this narrative
11 likesusers have liked this narrative
TR


tripledub on GQG Partners ·
The Cheap Genius Problem
Fair Value:AU$3.2154.7% undervalued
36 followersusers have followed this narrative
0 commentsusers have commented on this narrative
24 likesusers have liked this narrative
Recently Updated Narratives
RO


RockeTeller on Brightstar Resources ·
Brightstar Resources, A$1 Billion FCF at A$6,000 Gold, 74% IRR Under Construction + 2.87Moz Free Optionality
Fair Value:AU$2.2881.8% undervalued
1 followerusers have followed this narrative
0 commentsusers have commented on this narrative
0 likesusers have liked this narrative
RO

RogueEP on Super Micro Computer ·
Good-stock-not-great-company setup
Fair Value:US$55.8531.5% undervalued
1 followerusers have followed this narrative
0 commentsusers have commented on this narrative
0 likesusers have liked this narrative
VI


Victra on NVIDIA ·
NVDA Is Priced for a Decade of Growth — The Real Risk Is "How Long," Not "If"
Fair Value:US$174.9728.6% overvalued
1 followerusers have followed this narrative
0 commentsusers have commented on this narrative
0 likesusers have liked this narrative
Popular Narratives
OS

oscargarcia on NVIDIA ·
The company that went from selling GPUs to gamers to becoming the AI arms dealer of the 21st century.
Fair Value:US$28019.6% undervalued
319 followersusers have followed this narrative
9 commentsusers have commented on this narrative
16 likesusers have liked this narrative
CU

CubanEros on Microsoft ·
A wonderful business at reasonable price.
Fair Value:US$419.9114.4% overvalued
173 followersusers have followed this narrative
0 commentsusers have commented on this narrative
9 likesusers have liked this narrative
KI

KiwiInvest on Amazon.com ·
Amazon's high growth, high tech segments propel its profits, while traditional segments plod along
Fair Value:US$475.0945.0% undervalued
199 followersusers have followed this narrative
1 commentusers have commented on this narrative
8 likesusers have liked this narrative
Trending Discussion
JA
james_rxfd8 on Starfighters Space ·
How is this different to Virgin Orbit, which didn’t seem to work out, with a very similar plan?
4
|2
GE

george_b177x on Bloom Energy ·
Brilliant analysis. Great company with proven product and service!
1
|1