- United States
- /
- Media
- /
- NasdaqGM:TTD
Evaluating Trade Desk After Shares Surge 16% Despite Weak Year in 2025

Reviewed by Bailey Pemberton
Trying to decide what to do with Trade Desk stock right now? You are definitely not alone. Over the past month, Trade Desk’s share price has jumped a striking 16.0%, likely catching the attention of anyone who tracks the ad tech space. While such a bounce might suggest that optimism is returning, the brutal fact is that the stock is still down a whopping 55.5% year-to-date. That kind of swing can send even experienced investors searching for the story behind the numbers.
The truth is, short-term momentum, like the 1.6% uptick this past week, can mask bigger questions about how the market is really valuing Trade Desk. Is this recent rally just a blip on the radar, or the start of a sustained recovery? Wider changes in digital advertising and tech sector sentiment seem to be reshaping how investors stack up the risks versus the growth potential here. It is no surprise, then, that getting a solid read on value is top of mind for many.
If you are wondering whether Trade Desk is undervalued or simply in a rough patch, here is a quick stat: the company scores a 2 out of 6 on our value score, meaning it only passes two of the six valuation checks that typically signal a bargain. Let’s break down what these different valuation methods suggest, and keep reading for a final twist that might shed even more light on how to think about value in this changing market.
Trade Desk scores just 2/6 on our valuation checks. See what other red flags we found in the full valuation breakdown.
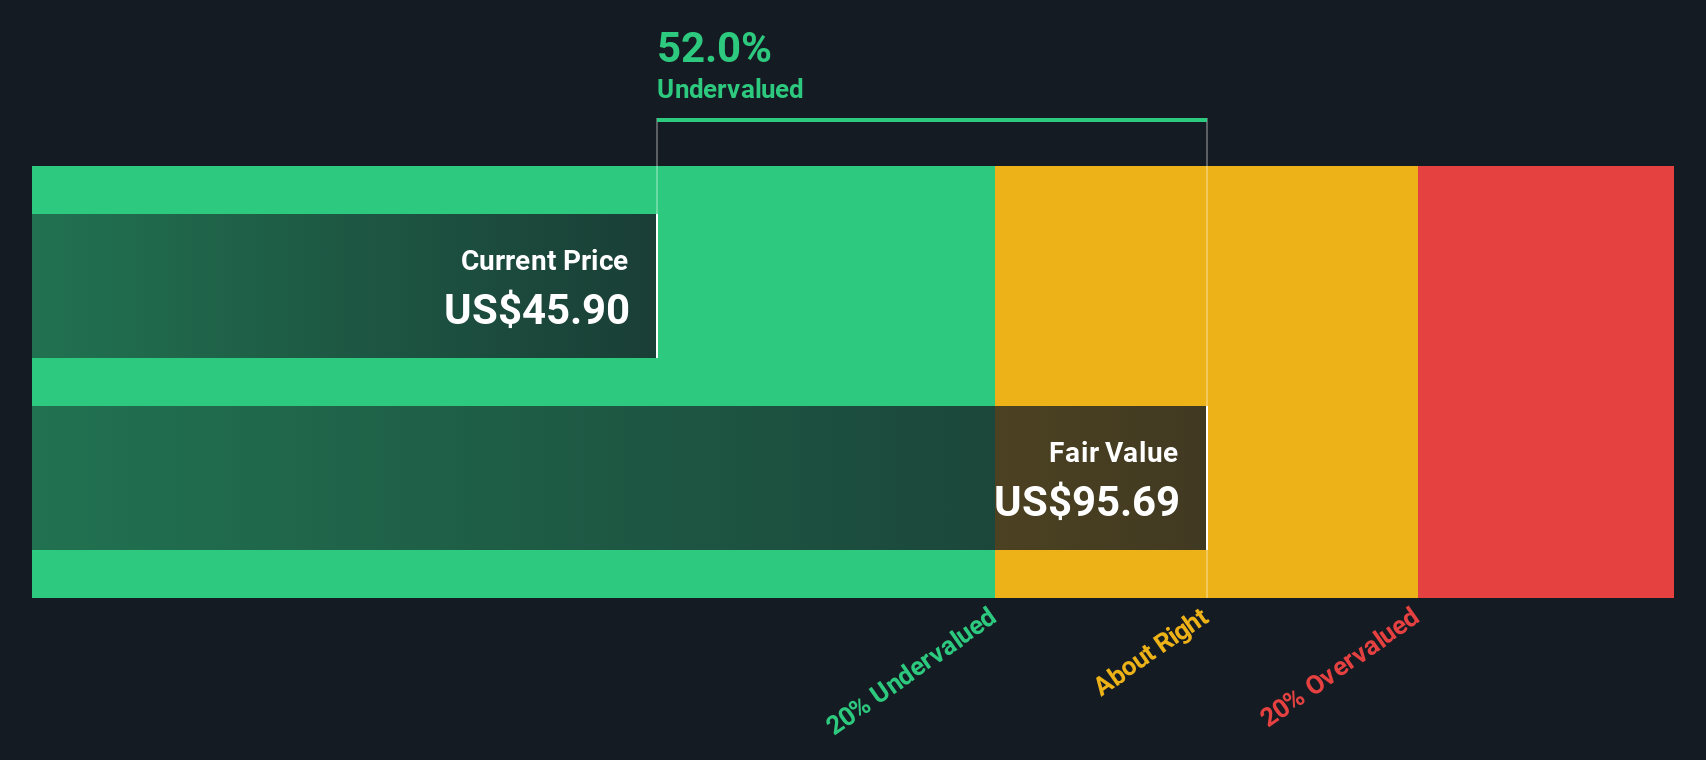
Approach 1: Trade Desk Discounted Cash Flow (DCF) Analysis
A Discounted Cash Flow (DCF) model estimates what a company should be worth by projecting its future cash flows and discounting them back to today's dollars. It is a popular tool for understanding the real, underlying value of a business, independent of current market noise.
For Trade Desk, the current Free Cash Flow (FCF) stands at $787.5 Million. Analysts have provided FCF projections for the next few years, with $958.0 Million forecast for 2026 and rising to $1,571.1 Million in 2029. After that, estimates extend out to 2035, with Simply Wall St extrapolating the numbers based on reasonable growth expectations in the digital advertising sector.
Using all these cash flow projections, the DCF valuation model calculates an intrinsic value of $96.49 per share. Compared to the current share price, this model suggests Trade Desk is trading at a 45.7% discount, marking the stock as notably undervalued according to this method.
Result: UNDERVALUED
Our Discounted Cash Flow (DCF) analysis suggests Trade Desk is undervalued by 45.7%. Track this in your watchlist or portfolio, or discover more undervalued stocks.
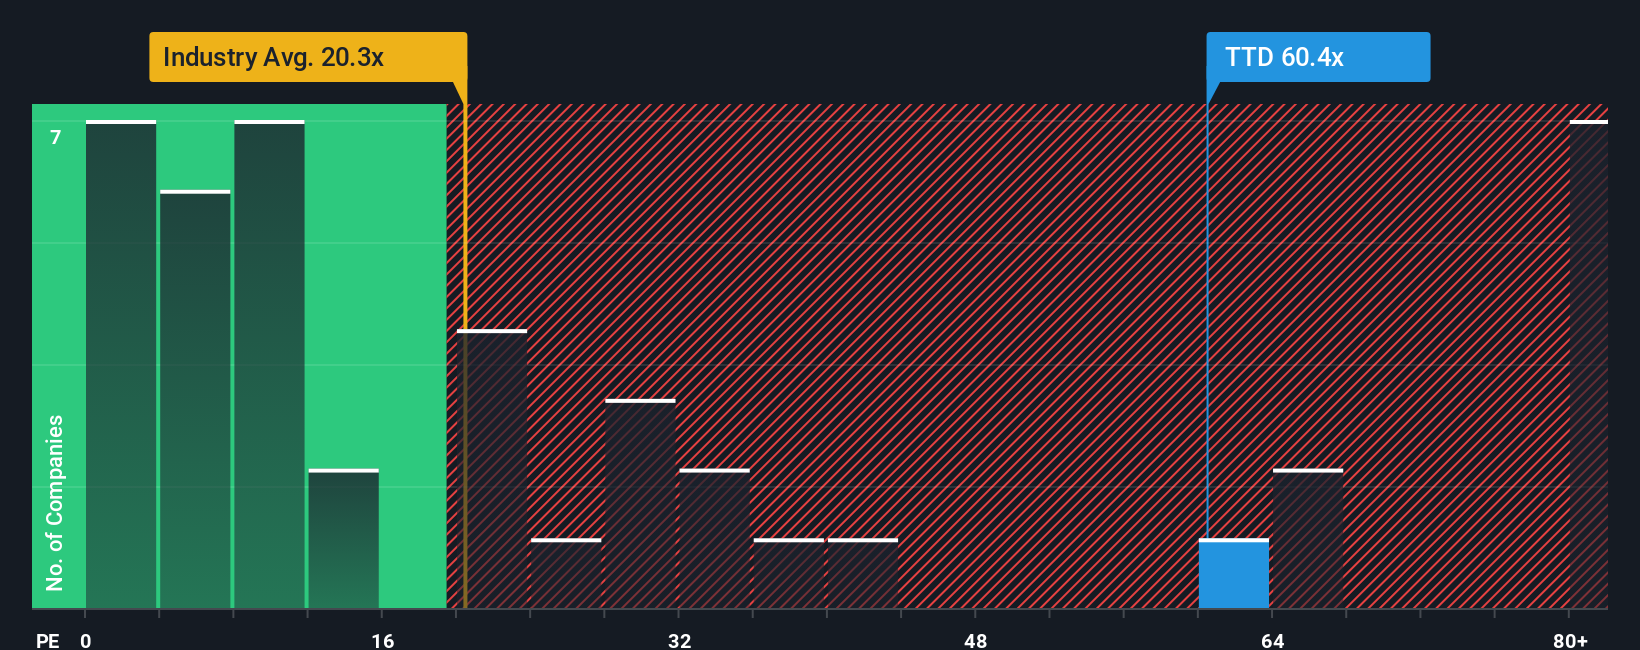
Approach 2: Trade Desk Price vs Earnings (PE Ratio)
The Price-to-Earnings (PE) ratio is a classic way to measure how the market is valuing a profitable company like Trade Desk. Since PE weighs the current share price against the company’s earnings, it is an ideal metric for mature businesses with consistent profits. It also offers a ready comparison between different companies in the same sector, making it easier to spot where the market may be getting either too excited or too cautious.
Of course, a "normal" or "fair" PE ratio is not the same for every business. Companies with faster expected earnings growth or lower risk profiles typically justify a higher PE, while those facing uncertainties tend to have lower multiples. It is important to factor in not just industry standards, but also Trade Desk’s unique growth prospects and competitive position.
Right now, Trade Desk has a PE ratio of 61.36x. Compared to the Media industry average of 18.82x and a peer group average of 31.14x, the stock is trading at a clear premium. However, Simply Wall St's Fair Ratio for Trade Desk comes in at 30.75x. The Fair Ratio goes deeper than a standard industry or peer comparison, as it integrates Trade Desk’s earnings growth outlook, profitability, market capitalization, and business risks into a single, more nuanced benchmark. This makes it a more holistic way to evaluate value than simply matching up against sector averages.
Comparing the actual PE ratio of 61.36x to the Fair Ratio of 30.75x suggests that Trade Desk’s shares are trading at a significant premium relative to what would be considered fair based on the underlying fundamentals.
Result: OVERVALUED
PE ratios tell one story, but what if the real opportunity lies elsewhere? Discover companies where insiders are betting big on explosive growth.
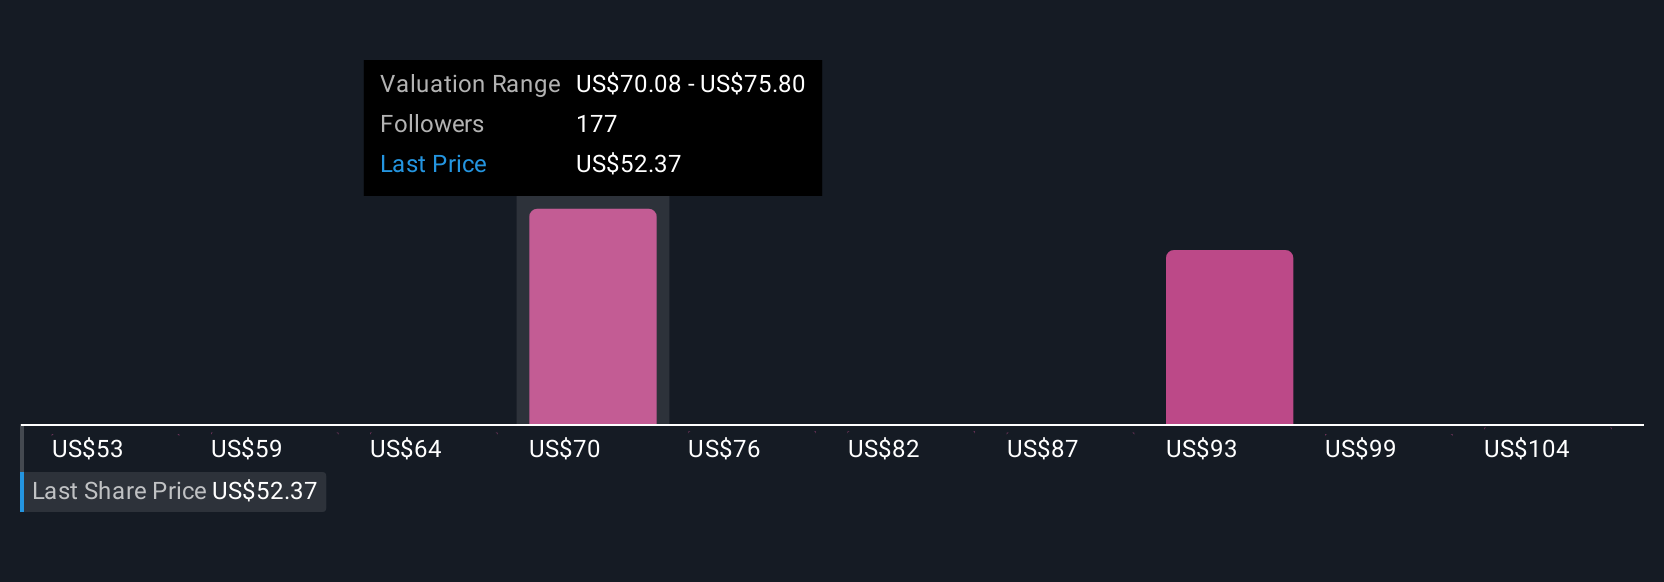
Upgrade Your Decision Making: Choose your Trade Desk Narrative
Earlier, we hinted that there is an even smarter approach to understanding value by introducing Narratives. A Narrative is your unique story about a company, combining your perspective on where Trade Desk is headed with hard numbers such as fair value, future revenues, earnings, and margins. Narratives connect the dots between a company's journey, your forecasts, and what you think the stock is truly worth.
This powerful tool is available on Simply Wall St’s Community page, making it easy and accessible for millions of investors to share, compare, and refine their investment outlooks. With Narratives, you can quickly test whether Trade Desk is a buy or a sell by comparing your Fair Value to the latest price. Because Narratives update instantly as news or earnings emerge, your view always remains current.
For example, the most optimistic Trade Desk Narrative expects rapid CTV expansion and innovation to drive the stock up toward $135, while the most cautious narrative anticipates headwinds and risks that could pull the price closer to $34. This range shows how Narratives let you align decision-making with your own assumptions, make smarter calls, and stay nimble as the story evolves.
Do you think there's more to the story for Trade Desk? Create your own Narrative to let the Community know!
This article by Simply Wall St is general in nature. We provide commentary based on historical data and analyst forecasts only using an unbiased methodology and our articles are not intended to be financial advice. It does not constitute a recommendation to buy or sell any stock, and does not take account of your objectives, or your financial situation. We aim to bring you long-term focused analysis driven by fundamental data. Note that our analysis may not factor in the latest price-sensitive company announcements or qualitative material. Simply Wall St has no position in any stocks mentioned.
The New Payments ETF Is Live on NASDAQ:
Money is moving to real-time rails, and a newly listed ETF now gives investors direct exposure. Fast settlement. Institutional custody. Simple access.
Explore how this launch could reshape portfolios
Sponsored ContentValuation is complex, but we're here to simplify it.
Discover if Trade Desk might be undervalued or overvalued with our detailed analysis, featuring fair value estimates, potential risks, dividends, insider trades, and its financial condition.
Access Free AnalysisHave feedback on this article? Concerned about the content? Get in touch with us directly. Alternatively, email editorial-team@simplywallst.com
About NasdaqGM:TTD
Trade Desk
Operates as a technology company in the United States and internationally.
Flawless balance sheet with high growth potential.
Similar Companies
Market Insights


Weekly Picks

Early mover in a fast growing industry. Likely to experience share price volatility as they scale


A case for CA$31.80 (undiluted), aka 8,616% upside from CA$0.37 (an 86 bagger!).


Moderation and Stabilisation: HOLD: Fair Price based on a 4-year Cycle is $12.08
Recently Updated Narratives


Title: Market Sentiment Is Dead Wrong — Here's Why PSEC Deserves a Second Look


An amazing opportunity to potentially get a 100 bagger

Amazon: Why the World’s Biggest Platform Still Runs on Invisible Economics
Popular Narratives


Crazy Undervalued 42 Baggers Silver Play (Active & Running Mine)


MicroVision will explode future revenue by 380.37% with a vision towards success


NVDA: Expanding AI Demand Will Drive Major Data Center Investments Through 2026
Trending Discussion
