
Advertisement
- United States
- /
- Media
- /
- OTCPK:STBX.F
Starbox Group Holdings' (NASDAQ:STBX) Earnings Might Be Weaker Than You Think
Starbox Group Holdings Ltd.'s (NASDAQ:STBX) solid earnings report last week was underwhelming to investors. We think that they may be worried about something else, so we did some analysis and found that investors have noticed some soft numbers underlying the profit.
View our latest analysis for Starbox Group Holdings
Zooming In On Starbox Group Holdings' Earnings
As finance nerds would already know, the accrual ratio from cashflow is a key measure for assessing how well a company's free cash flow (FCF) matches its profit. To get the accrual ratio we first subtract FCF from profit for a period, and then divide that number by the average operating assets for the period. The ratio shows us how much a company's profit exceeds its FCF.
That means a negative accrual ratio is a good thing, because it shows that the company is bringing in more free cash flow than its profit would suggest. While having an accrual ratio above zero is of little concern, we do think it's worth noting when a company has a relatively high accrual ratio. That's because some academic studies have suggested that high accruals ratios tend to lead to lower profit or less profit growth.
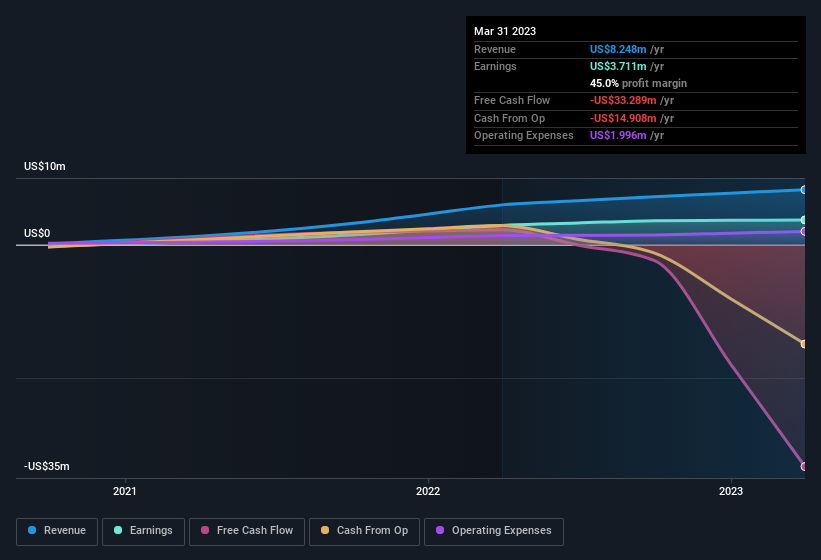
Over the twelve months to March 2023, Starbox Group Holdings recorded an accrual ratio of 1.95. Statistically speaking, that's a real negative for future earnings. And indeed, during the period the company didn't produce any free cash flow whatsoever. Even though it reported a profit of US$3.71m, a look at free cash flow indicates it actually burnt through US$33m in the last year. It's worth noting that Starbox Group Holdings generated positive FCF of US$2.2m a year ago, so at least they've done it in the past. Unfortunately for shareholders, the company has also been issuing new shares, diluting their share of future earnings.
Note: we always recommend investors check balance sheet strength. Click here to be taken to our balance sheet analysis of Starbox Group Holdings.
In order to understand the potential for per share returns, it is essential to consider how much a company is diluting shareholders. Starbox Group Holdings expanded the number of shares on issue by 39% over the last year. Therefore, each share now receives a smaller portion of profit. To celebrate net income while ignoring dilution is like rejoicing because you have a single slice of a larger pizza, but ignoring the fact that the pizza is now cut into many more slices. You can see a chart of Starbox Group Holdings' EPS by clicking here.
A Look At The Impact Of Starbox Group Holdings' Dilution On Its Earnings Per Share (EPS)
Unfortunately, we don't have any visibility into its profits three years back, because we lack the data. The good news is that profit was up 28% in the last twelve months. On the other hand, earnings per share are only up 9.0% over the same period. So you can see that the dilution has had a fairly significant impact on shareholders.
In the long term, earnings per share growth should beget share price growth. So Starbox Group Holdings shareholders will want to see that EPS figure continue to increase. However, if its profit increases while its earnings per share stay flat (or even fall) then shareholders might not see much benefit. For that reason, you could say that EPS is more important that net income in the long run, assuming the goal is to assess whether a company's share price might grow.
Our Take On Starbox Group Holdings' Profit Performance
As it turns out, Starbox Group Holdings couldn't match its profit with cashflow and its dilution means that earnings per share growth is lagging net income growth. For the reasons mentioned above, we think that a perfunctory glance at Starbox Group Holdings' statutory profits might make it look better than it really is on an underlying level. With this in mind, we wouldn't consider investing in a stock unless we had a thorough understanding of the risks. For example, we've found that Starbox Group Holdings has 3 warning signs (1 doesn't sit too well with us!) that deserve your attention before going any further with your analysis.
In this article we've looked at a number of factors that can impair the utility of profit numbers, and we've come away cautious. But there is always more to discover if you are capable of focussing your mind on minutiae. For example, many people consider a high return on equity as an indication of favorable business economics, while others like to 'follow the money' and search out stocks that insiders are buying. So you may wish to see this free collection of companies boasting high return on equity, or this list of stocks that insiders are buying.
New: Manage All Your Stock Portfolios in One Place
We've created the ultimate portfolio companion for stock investors, and it's free.
• Connect an unlimited number of Portfolios and see your total in one currency
• Be alerted to new Warning Signs or Risks via email or mobile
• Track the Fair Value of your stocks
Have feedback on this article? Concerned about the content? Get in touch with us directly. Alternatively, email editorial-team (at) simplywallst.com.
This article by Simply Wall St is general in nature. We provide commentary based on historical data and analyst forecasts only using an unbiased methodology and our articles are not intended to be financial advice. It does not constitute a recommendation to buy or sell any stock, and does not take account of your objectives, or your financial situation. We aim to bring you long-term focused analysis driven by fundamental data. Note that our analysis may not factor in the latest price-sensitive company announcements or qualitative material. Simply Wall St has no position in any stocks mentioned.
About OTCPK:STBX.F
Starbox Group Holdings
Through its subsidiaries, engages in the provision of cash rebate, digital advertising, and payment solution services to retail merchant in Malaysia.
Moderate risk with mediocre balance sheet.
Market Insights

Advertisement
Community Narratives
MicroVision will explode future revenue by 380.37% with a vision towards success
Fair Value US$60.00|98.4% undervalued
TH
Community Contributor
The Indispensable Artery for a New North American Economy
Fair Value CA$132.87|1.3% undervalued
TI
Community Contributor