
Advertisement
- United States
- /
- Media
- /
- NasdaqGS:SSP
The E.W. Scripps Company (NASDAQ:SSP) Stock's 25% Dive Might Signal An Opportunity But It Requires Some Scrutiny
To the annoyance of some shareholders, The E.W. Scripps Company (NASDAQ:SSP) shares are down a considerable 25% in the last month, which continues a horrid run for the company. The recent drop completes a disastrous twelve months for shareholders, who are sitting on a 60% loss during that time.
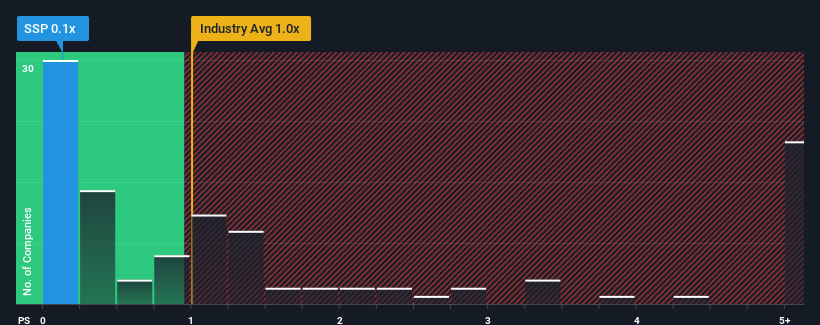
Since its price has dipped substantially, E.W. Scripps' price-to-sales (or "P/S") ratio of 0.1x might make it look like a buy right now compared to the Media industry in the United States, where around half of the companies have P/S ratios above 1x and even P/S above 3x are quite common. Nonetheless, we'd need to dig a little deeper to determine if there is a rational basis for the reduced P/S.
View our latest analysis for E.W. Scripps
What Does E.W. Scripps' P/S Mean For Shareholders?
While the industry has experienced revenue growth lately, E.W. Scripps' revenue has gone into reverse gear, which is not great. It seems that many are expecting the poor revenue performance to persist, which has repressed the P/S ratio. If this is the case, then existing shareholders will probably struggle to get excited about the future direction of the share price.
Want the full picture on analyst estimates for the company? Then our free report on E.W. Scripps will help you uncover what's on the horizon.What Are Revenue Growth Metrics Telling Us About The Low P/S?
E.W. Scripps' P/S ratio would be typical for a company that's only expected to deliver limited growth, and importantly, perform worse than the industry.
Taking a look back first, the company's revenue growth last year wasn't something to get excited about as it posted a disappointing decline of 6.5%. That put a dampener on the good run it was having over the longer-term as its three-year revenue growth is still a noteworthy 23% in total. So we can start by confirming that the company has generally done a good job of growing revenue over that time, even though it had some hiccups along the way.
Looking ahead now, revenue is anticipated to climb by 5.7% each year during the coming three years according to the five analysts following the company. That's shaping up to be similar to the 4.4% per annum growth forecast for the broader industry.
In light of this, it's peculiar that E.W. Scripps' P/S sits below the majority of other companies. It may be that most investors are not convinced the company can achieve future growth expectations.
What Does E.W. Scripps' P/S Mean For Investors?
E.W. Scripps' P/S has taken a dip along with its share price. Generally, our preference is to limit the use of the price-to-sales ratio to establishing what the market thinks about the overall health of a company.
We've seen that E.W. Scripps currently trades on a lower than expected P/S since its forecast growth is in line with the wider industry. The low P/S could be an indication that the revenue growth estimates are being questioned by the market. At least the risk of a price drop looks to be subdued, but investors seem to think future revenue could see some volatility.
It's always necessary to consider the ever-present spectre of investment risk. We've identified 1 warning sign with E.W. Scripps, and understanding should be part of your investment process.
If these risks are making you reconsider your opinion on E.W. Scripps, explore our interactive list of high quality stocks to get an idea of what else is out there.
Valuation is complex, but we're here to simplify it.
Discover if E.W. Scripps might be undervalued or overvalued with our detailed analysis, featuring fair value estimates, potential risks, dividends, insider trades, and its financial condition.
Access Free AnalysisHave feedback on this article? Concerned about the content? Get in touch with us directly. Alternatively, email editorial-team (at) simplywallst.com.
This article by Simply Wall St is general in nature. We provide commentary based on historical data and analyst forecasts only using an unbiased methodology and our articles are not intended to be financial advice. It does not constitute a recommendation to buy or sell any stock, and does not take account of your objectives, or your financial situation. We aim to bring you long-term focused analysis driven by fundamental data. Note that our analysis may not factor in the latest price-sensitive company announcements or qualitative material. Simply Wall St has no position in any stocks mentioned.
About NasdaqGS:SSP
E.W. Scripps
Operates as a media enterprise through a portfolio of local television stations, national news, and entertainment networks in the United States.
Undervalued with moderate growth potential.
Similar Companies
Market Insights

Advertisement
Community Narratives
MicroVision will explode future revenue by 380.37% with a vision towards success
Fair Value US$60.00|98.4% undervalued
TH
Community Contributor
The Indispensable Artery for a New North American Economy
Fair Value CA$132.87|1.3% undervalued
TI
Community Contributor