Stock Analysis
- United States
- /
- Media
- /
- NasdaqCM:SGRP
Is SPAR Group, Inc.'s (NASDAQ:SGRP) Recent Stock Performance Influenced By Its Fundamentals In Any Way?


SPAR Group's (NASDAQ:SGRP) stock is up by a considerable 149% over the past three months. As most would know, fundamentals are what usually guide market price movements over the long-term, so we decided to look at the company's key financial indicators today to determine if they have any role to play in the recent price movement. In this article, we decided to focus on SPAR Group's ROE.
ROE or return on equity is a useful tool to assess how effectively a company can generate returns on the investment it received from its shareholders. In short, ROE shows the profit each dollar generates with respect to its shareholder investments.
Check out our latest analysis for SPAR Group
How Is ROE Calculated?
ROE can be calculated by using the formula:
Return on Equity = Net Profit (from continuing operations) ÷ Shareholders' Equity
So, based on the above formula, the ROE for SPAR Group is:
25% = US$10m ÷ US$40m (Based on the trailing twelve months to March 2024).
The 'return' is the yearly profit. That means that for every $1 worth of shareholders' equity, the company generated $0.25 in profit.
What Has ROE Got To Do With Earnings Growth?
Thus far, we have learned that ROE measures how efficiently a company is generating its profits. Based on how much of its profits the company chooses to reinvest or "retain", we are then able to evaluate a company's future ability to generate profits. Assuming everything else remains unchanged, the higher the ROE and profit retention, the higher the growth rate of a company compared to companies that don't necessarily bear these characteristics.
A Side By Side comparison of SPAR Group's Earnings Growth And 25% ROE
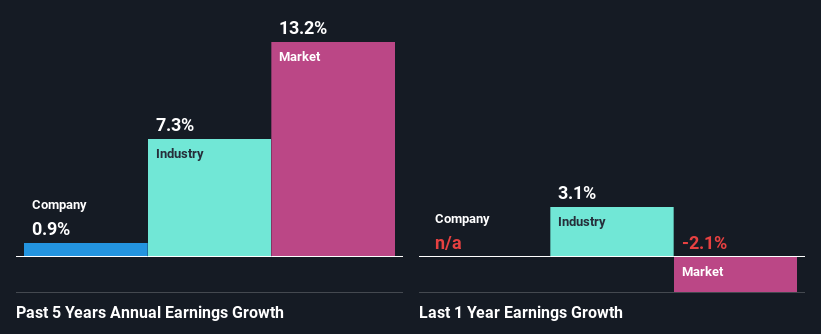
To begin with, SPAR Group has a pretty high ROE which is interesting. Secondly, even when compared to the industry average of 14% the company's ROE is quite impressive. Given the circumstances, we can't help but wonder why SPAR Group saw little to no growth in the past five years. So, there could be some other aspects that could potentially be preventing the company from growing. These include low earnings retention or poor allocation of capital
Next, on comparing with the industry net income growth, we found that SPAR Group's reported growth was lower than the industry growth of 7.3% over the last few years, which is not something we like to see.
Earnings growth is a huge factor in stock valuation. What investors need to determine next is if the expected earnings growth, or the lack of it, is already built into the share price. This then helps them determine if the stock is placed for a bright or bleak future. One good indicator of expected earnings growth is the P/E ratio which determines the price the market is willing to pay for a stock based on its earnings prospects. So, you may want to check if SPAR Group is trading on a high P/E or a low P/E, relative to its industry.
Is SPAR Group Using Its Retained Earnings Effectively?
SPAR Group doesn't pay any regular dividends, meaning that the company is keeping all of its profits, which makes us wonder why it is retaining its earnings if it can't use them to grow its business. It looks like there might be some other reasons to explain the lack in that respect. For example, the business could be in decline.
Summary
Overall, we feel that SPAR Group certainly does have some positive factors to consider. However, given the high ROE and high profit retention, we would expect the company to be delivering strong earnings growth, but that isn't the case here. This suggests that there might be some external threat to the business, that's hampering its growth. Having said that, on studying current analyst estimates, we were concerned to see that while the company has grown its earnings in the past, analysts expect its earnings to shrink in the future. To know more about the latest analysts predictions for the company, check out this visualization of analyst forecasts for the company.
Valuation is complex, but we're helping make it simple.
Find out whether SPAR Group is potentially over or undervalued by checking out our comprehensive analysis, which includes fair value estimates, risks and warnings, dividends, insider transactions and financial health.
View the Free AnalysisHave feedback on this article? Concerned about the content? Get in touch with us directly. Alternatively, email editorial-team (at) simplywallst.com.
This article by Simply Wall St is general in nature. We provide commentary based on historical data and analyst forecasts only using an unbiased methodology and our articles are not intended to be financial advice. It does not constitute a recommendation to buy or sell any stock, and does not take account of your objectives, or your financial situation. We aim to bring you long-term focused analysis driven by fundamental data. Note that our analysis may not factor in the latest price-sensitive company announcements or qualitative material. Simply Wall St has no position in any stocks mentioned.
Valuation is complex, but we're helping make it simple.
Find out whether SPAR Group is potentially over or undervalued by checking out our comprehensive analysis, which includes fair value estimates, risks and warnings, dividends, insider transactions and financial health.
View the Free AnalysisHave feedback on this article? Concerned about the content? Get in touch with us directly. Alternatively, email editorial-team@simplywallst.com
About NasdaqCM:SGRP
SPAR Group
Provides merchandising and brand marketing services in the Americas, the Asia-Pacific, Europe, Middle East, and Africa.
Good value with adequate balance sheet.
