
Advertisement
- United States
- /
- Media
- /
- NasdaqGS:SBGI
Sinclair, Inc. Just Beat Earnings Expectations: Here's What Analysts Think Will Happen Next
Sinclair, Inc. (NASDAQ:SBGI) came out with its full-year results last week, and we wanted to see how the business is performing and what industry forecasters think of the company following this report. It looks like a credible result overall - although revenues of US$3.5b were in line with what the analysts predicted, Sinclair surprised by delivering a statutory profit of US$4.69 per share, a notable 17% above expectations. Earnings are an important time for investors, as they can track a company's performance, look at what the analysts are forecasting for next year, and see if there's been a change in sentiment towards the company. So we collected the latest post-earnings statutory consensus estimates to see what could be in store for next year.
Check out our latest analysis for Sinclair
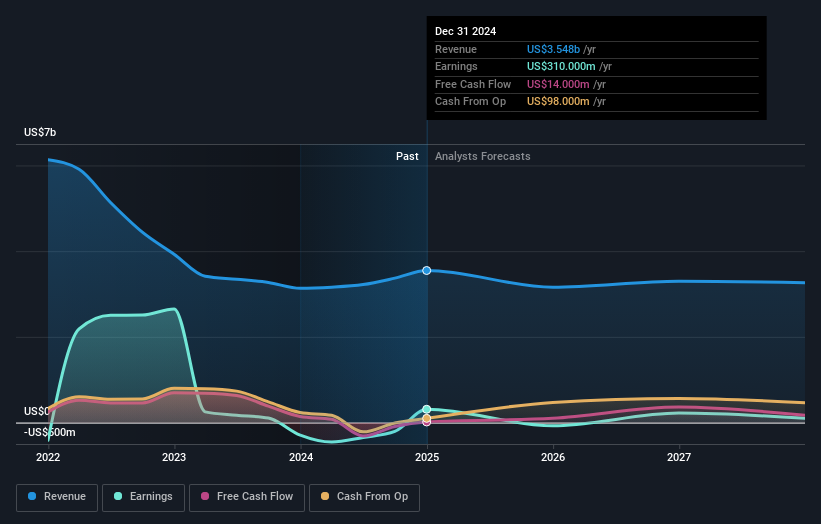
Taking into account the latest results, the six analysts covering Sinclair provided consensus estimates of US$3.16b revenue in 2025, which would reflect an uncomfortable 11% decline over the past 12 months. Earnings are expected to tip over into lossmaking territory, with the analysts forecasting statutory losses of -US$0.067 per share in 2025. Before this latest report, the consensus had been expecting revenues of US$3.23b and US$0.88 per share in losses. While the revenue estimates fell, sentiment seems to have improved, with the analysts making a considerable decrease in losses per share in particular.
There was no major change to the US$17.71average price target, suggesting that the adjustments to revenue and earnings are not expected to have a long-term impact on the business. That's not the only conclusion we can draw from this data however, as some investors also like to consider the spread in estimates when evaluating analyst price targets. Currently, the most bullish analyst values Sinclair at US$30.00 per share, while the most bearish prices it at US$12.00. We would probably assign less value to the analyst forecasts in this situation, because such a wide range of estimates could imply that the future of this business is difficult to value accurately. As a result it might not be a great idea to make decisions based on the consensus price target, which is after all just an average of this wide range of estimates.
Looking at the bigger picture now, one of the ways we can make sense of these forecasts is to see how they measure up against both past performance and industry growth estimates. One thing that stands out from these estimates is that revenues are expected to keep falling until the end of 2025, roughly in line with the historical decline of 13% per annum over the past five years. Compare this against analyst estimates for companies in the broader industry, which suggest that revenues (in aggregate) are expected to grow 2.8% annually. So it's pretty clear that, while it does have declining revenues, the analysts also expect Sinclair to suffer worse than the wider industry.
The Bottom Line
The most obvious conclusion is that the analysts made no changes to their forecasts for a loss next year. On the negative side, they also downgraded their revenue estimates, and forecasts imply they will perform worse than the wider industry. Even so, long term profitability is more important for the value creation process. The consensus price target held steady at US$17.71, with the latest estimates not enough to have an impact on their price targets.
With that said, the long-term trajectory of the company's earnings is a lot more important than next year. We have estimates - from multiple Sinclair analysts - going out to 2027, and you can see them free on our platform here.
Plus, you should also learn about the 3 warning signs we've spotted with Sinclair (including 2 which are a bit unpleasant) .
New: Manage All Your Stock Portfolios in One Place
We've created the ultimate portfolio companion for stock investors, and it's free.
• Connect an unlimited number of Portfolios and see your total in one currency
• Be alerted to new Warning Signs or Risks via email or mobile
• Track the Fair Value of your stocks
Have feedback on this article? Concerned about the content? Get in touch with us directly. Alternatively, email editorial-team (at) simplywallst.com.
This article by Simply Wall St is general in nature. We provide commentary based on historical data and analyst forecasts only using an unbiased methodology and our articles are not intended to be financial advice. It does not constitute a recommendation to buy or sell any stock, and does not take account of your objectives, or your financial situation. We aim to bring you long-term focused analysis driven by fundamental data. Note that our analysis may not factor in the latest price-sensitive company announcements or qualitative material. Simply Wall St has no position in any stocks mentioned.
About NasdaqGS:SBGI
Sinclair
A media company, provides content on local television stations and digital platforms in the United States.
Established dividend payer with reasonable growth potential.
Similar Companies
Market Insights

Advertisement
Community Narratives
MicroVision will explode future revenue by 380.37% with a vision towards success
Fair Value US$60|98.4% undervalued
TH
Community Contributor
The Indispensable Artery for a New North American Economy
Fair Value CA$132.87|0.7% overvalued
TI
Community Contributor
Recently Updated Narratives
BE


Bejgal on MINISO Group Holding ·
MINISO's fair value is projected at 26.69 with an anticipated PE ratio shift of 20x
Fair Value:US$28.1829.5% undervalued
46 followersusers have followed this narrative
3 commentsusers have commented on this narrative
0 likesusers have liked this narrative
BE

Bejgal on Fiverr International ·
Fiverr International will transform the freelance industry with AI-powered growth
Fair Value:US$36.8143.1% undervalued
79 followersusers have followed this narrative
7 commentsusers have commented on this narrative
0 likesusers have liked this narrative
CE

cementafriend on Constellation Energy ·
Constellation Energy Dividends and Growth
Fair Value:US$348.054.7% overvalued
2 followersusers have followed this narrative
0 commentsusers have commented on this narrative
0 likesusers have liked this narrative
Popular Narratives
TH

TheWallstreetKing on MicroVision ·
MicroVision will explode future revenue by 380.37% with a vision towards success
Fair Value:US$6098.4% undervalued
109 followersusers have followed this narrative
10 commentsusers have commented on this narrative
21 likesusers have liked this narrative
AN


AnalystConsensusTarget on NVIDIA ·
NVDA: Expanding AI Demand Will Drive Major Data Center Investments Through 2026
Fair Value:US$250.3929.3% undervalued
937 followersusers have followed this narrative
6 commentsusers have commented on this narrative
24 likesusers have liked this narrative
OS


oscargarcia on Alphabet ·
The company that turned a verb into a global necessity and basically runs the modern internet, digital ads, smartphones, maps, and AI.
Fair Value:US$3405.8% undervalued
145 followersusers have followed this narrative
6 commentsusers have commented on this narrative
18 likesusers have liked this narrative