
Some say volatility, rather than debt, is the best way to think about risk as an investor, but Warren Buffett famously said that 'Volatility is far from synonymous with risk.' When we think about how risky a company is, we always like to look at its use of debt, since debt overload can lead to ruin. Importantly, Sinclair, Inc. (NASDAQ:SBGI) does carry debt. But the real question is whether this debt is making the company risky.
When Is Debt A Problem?
Debt is a tool to help businesses grow, but if a business is incapable of paying off its lenders, then it exists at their mercy. Ultimately, if the company can't fulfill its legal obligations to repay debt, shareholders could walk away with nothing. However, a more common (but still painful) scenario is that it has to raise new equity capital at a low price, thus permanently diluting shareholders. By replacing dilution, though, debt can be an extremely good tool for businesses that need capital to invest in growth at high rates of return. When we examine debt levels, we first consider both cash and debt levels, together.
See our latest analysis for Sinclair
What Is Sinclair's Debt?
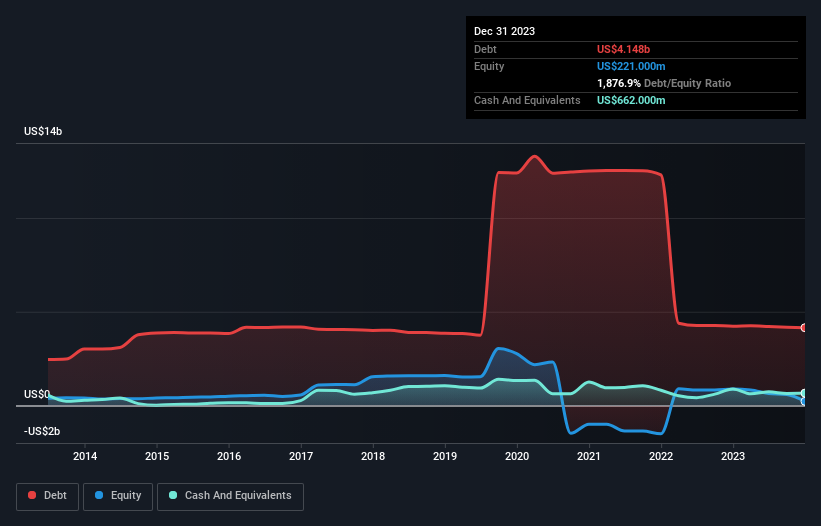
As you can see below, Sinclair had US$4.15b of debt, at December 2023, which is about the same as the year before. You can click the chart for greater detail. However, it does have US$662.0m in cash offsetting this, leading to net debt of about US$3.49b.
How Strong Is Sinclair's Balance Sheet?
The latest balance sheet data shows that Sinclair had liabilities of US$1.10b due within a year, and liabilities of US$4.76b falling due after that. Offsetting these obligations, it had cash of US$662.0m as well as receivables valued at US$624.0m due within 12 months. So its liabilities total US$4.58b more than the combination of its cash and short-term receivables.
This deficit casts a shadow over the US$796.3m company, like a colossus towering over mere mortals. So we'd watch its balance sheet closely, without a doubt. After all, Sinclair would likely require a major re-capitalisation if it had to pay its creditors today. The balance sheet is clearly the area to focus on when you are analysing debt. But ultimately the future profitability of the business will decide if Sinclair can strengthen its balance sheet over time. So if you want to see what the professionals think, you might find this free report on analyst profit forecasts to be interesting.
In the last year Sinclair had a loss before interest and tax, and actually shrunk its revenue by 20%, to US$3.1b. That makes us nervous, to say the least.
Caveat Emptor
While Sinclair's falling revenue is about as heartwarming as a wet blanket, arguably its earnings before interest and tax (EBIT) loss is even less appealing. Its EBIT loss was a whopping US$316m. Combining this information with the significant liabilities we already touched on makes us very hesitant about this stock, to say the least. That said, it is possible that the company will turn its fortunes around. Nevertheless, we would not bet on it given that it lost US$291m in just last twelve months, and it doesn't have much by way of liquid assets. So we think this stock is quite risky. We'd prefer to pass. There's no doubt that we learn most about debt from the balance sheet. But ultimately, every company can contain risks that exist outside of the balance sheet. These risks can be hard to spot. Every company has them, and we've spotted 4 warning signs for Sinclair (of which 1 shouldn't be ignored!) you should know about.
If you're interested in investing in businesses that can grow profits without the burden of debt, then check out this free list of growing businesses that have net cash on the balance sheet.
Mobile Infrastructure for Defense and Disaster
The next wave in robotics isn't humanoid. Its fully autonomous towers delivering 5G, ISR, and radar in under 30 minutes, anywhere.
Get the investor briefing before the next round of contracts
Sponsored On Behalf of CiTechNew: Manage All Your Stock Portfolios in One Place
We've created the ultimate portfolio companion for stock investors, and it's free.
• Connect an unlimited number of Portfolios and see your total in one currency
• Be alerted to new Warning Signs or Risks via email or mobile
• Track the Fair Value of your stocks
Have feedback on this article? Concerned about the content? Get in touch with us directly. Alternatively, email editorial-team (at) simplywallst.com.
This article by Simply Wall St is general in nature. We provide commentary based on historical data and analyst forecasts only using an unbiased methodology and our articles are not intended to be financial advice. It does not constitute a recommendation to buy or sell any stock, and does not take account of your objectives, or your financial situation. We aim to bring you long-term focused analysis driven by fundamental data. Note that our analysis may not factor in the latest price-sensitive company announcements or qualitative material. Simply Wall St has no position in any stocks mentioned.
About NasdaqGS:SBGI
Sinclair
A media company, provides content on local television stations and digital platforms in the United States.
Undervalued established dividend payer.
Similar Companies
Market Insights

Weekly Picks

Early mover in a fast growing industry. Likely to experience share price volatility as they scale


A case for CA$31.80 (undiluted), aka 8,616% upside from CA$0.37 (an 86 bagger!).


Moderation and Stabilisation: HOLD: Fair Price based on a 4-year Cycle is $12.08
Recently Updated Narratives

Airbnb Stock: Platform Growth in a World of Saturation and Scrutiny

Adobe Stock: AI-Fueled ARR Growth Pushes Guidance Higher, But Cost Pressures Loom

Thomson Reuters Stock: When Legal Intelligence Becomes Mission-Critical Infrastructure
Popular Narratives


Crazy Undervalued 42 Baggers Silver Play (Active & Running Mine)


NVDA: Expanding AI Demand Will Drive Major Data Center Investments Through 2026

The AI Infrastructure Giant Grows Into Its Valuation
Trending Discussion


