
Advertisement
- United States
- /
- Interactive Media and Services
- /
- NasdaqGS:GOOGL
Does Alphabet (NASDAQ:GOOGL) Have A Healthy Balance Sheet?
Warren Buffett famously said, 'Volatility is far from synonymous with risk.' So it seems the smart money knows that debt - which is usually involved in bankruptcies - is a very important factor, when you assess how risky a company is. Importantly, Alphabet Inc. (NASDAQ:GOOGL) does carry debt. But the real question is whether this debt is making the company risky.
When Is Debt A Problem?
Debt assists a business until the business has trouble paying it off, either with new capital or with free cash flow. In the worst case scenario, a company can go bankrupt if it cannot pay its creditors. While that is not too common, we often do see indebted companies permanently diluting shareholders because lenders force them to raise capital at a distressed price. By replacing dilution, though, debt can be an extremely good tool for businesses that need capital to invest in growth at high rates of return. When we examine debt levels, we first consider both cash and debt levels, together.
See our latest analysis for Alphabet
What Is Alphabet's Net Debt?
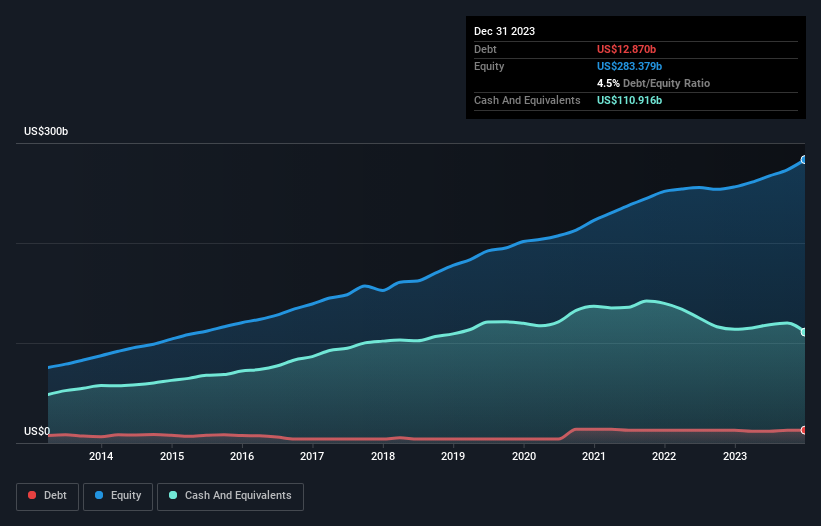
As you can see below, Alphabet had US$12.9b of debt, at December 2023, which is about the same as the year before. You can click the chart for greater detail. But on the other hand it also has US$110.9b in cash, leading to a US$98.0b net cash position.
A Look At Alphabet's Liabilities
We can see from the most recent balance sheet that Alphabet had liabilities of US$81.8b falling due within a year, and liabilities of US$37.2b due beyond that. On the other hand, it had cash of US$110.9b and US$48.0b worth of receivables due within a year. So it actually has US$39.9b more liquid assets than total liabilities.
This surplus suggests that Alphabet has a conservative balance sheet, and could probably eliminate its debt without much difficulty. Simply put, the fact that Alphabet has more cash than debt is arguably a good indication that it can manage its debt safely.
And we also note warmly that Alphabet grew its EBIT by 18% last year, making its debt load easier to handle. When analysing debt levels, the balance sheet is the obvious place to start. But it is future earnings, more than anything, that will determine Alphabet's ability to maintain a healthy balance sheet going forward. So if you're focused on the future you can check out this free report showing analyst profit forecasts.
Finally, while the tax-man may adore accounting profits, lenders only accept cold hard cash. Alphabet may have net cash on the balance sheet, but it is still interesting to look at how well the business converts its earnings before interest and tax (EBIT) to free cash flow, because that will influence both its need for, and its capacity to manage debt. Over the last three years, Alphabet recorded free cash flow worth a fulsome 81% of its EBIT, which is stronger than we'd usually expect. That puts it in a very strong position to pay down debt.
Summing Up
While it is always sensible to investigate a company's debt, in this case Alphabet has US$98.0b in net cash and a decent-looking balance sheet. The cherry on top was that in converted 81% of that EBIT to free cash flow, bringing in US$69b. So we don't think Alphabet's use of debt is risky. Above most other metrics, we think its important to track how fast earnings per share is growing, if at all. If you've also come to that realization, you're in luck, because today you can view this interactive graph of Alphabet's earnings per share history for free.
If, after all that, you're more interested in a fast growing company with a rock-solid balance sheet, then check out our list of net cash growth stocks without delay.
New: Manage All Your Stock Portfolios in One Place
We've created the ultimate portfolio companion for stock investors, and it's free.
• Connect an unlimited number of Portfolios and see your total in one currency
• Be alerted to new Warning Signs or Risks via email or mobile
• Track the Fair Value of your stocks
Have feedback on this article? Concerned about the content? Get in touch with us directly. Alternatively, email editorial-team (at) simplywallst.com.
This article by Simply Wall St is general in nature. We provide commentary based on historical data and analyst forecasts only using an unbiased methodology and our articles are not intended to be financial advice. It does not constitute a recommendation to buy or sell any stock, and does not take account of your objectives, or your financial situation. We aim to bring you long-term focused analysis driven by fundamental data. Note that our analysis may not factor in the latest price-sensitive company announcements or qualitative material. Simply Wall St has no position in any stocks mentioned.
About NasdaqGS:GOOGL
Alphabet
Offers various products and platforms in the United States, Europe, the Middle East, Africa, the Asia-Pacific, Canada, and Latin America.
Solid track record with excellent balance sheet.
Similar Companies
Market Insights

Advertisement
Community Narratives
Finding The True Value Of A Logistics Powerhouse
Fair Value US$95.21|8.6% undervalued
NV
Community Contributor
Paradigm Biopharmaceuticals Will Lead Osteoarthritis Treatment with Zilosul's FDA Success
Fair Value AU$5.50|92.1% undervalued
AM
Community Contributor
Barrick Mining (ABX:CA): A Gold Hedge against a U.S. Shutdown
Fair Value CA$60.00|25.6% undervalued
GM
Community Contributor