
Advertisement
- United States
- /
- Interactive Media and Services
- /
- NasdaqGS:ANGI
Does Angi (NASDAQ:ANGI) Have A Healthy Balance Sheet?
David Iben put it well when he said, 'Volatility is not a risk we care about. What we care about is avoiding the permanent loss of capital.' It's only natural to consider a company's balance sheet when you examine how risky it is, since debt is often involved when a business collapses. We note that Angi Inc. (NASDAQ:ANGI) does have debt on its balance sheet. But the more important question is: how much risk is that debt creating?
Why Does Debt Bring Risk?
Generally speaking, debt only becomes a real problem when a company can't easily pay it off, either by raising capital or with its own cash flow. If things get really bad, the lenders can take control of the business. However, a more usual (but still expensive) situation is where a company must dilute shareholders at a cheap share price simply to get debt under control. Having said that, the most common situation is where a company manages its debt reasonably well - and to its own advantage. When we examine debt levels, we first consider both cash and debt levels, together.
Check out our latest analysis for Angi
What Is Angi's Debt?
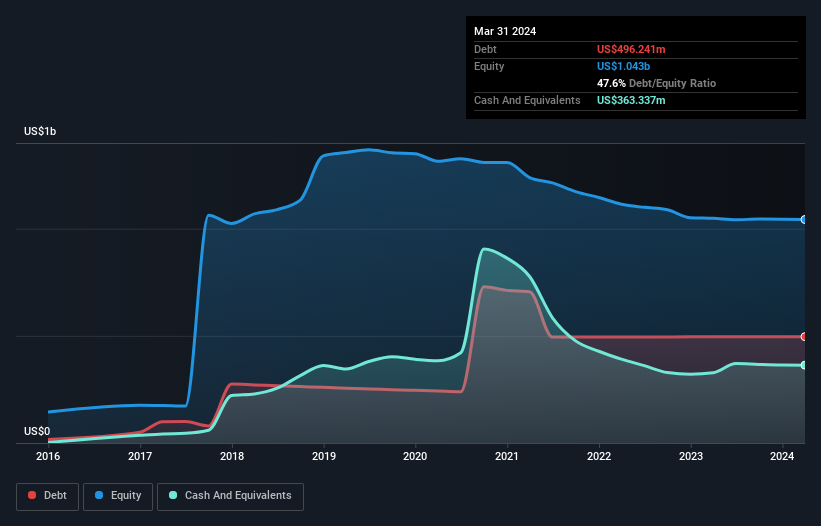
The chart below, which you can click on for greater detail, shows that Angi had US$496.2m in debt in March 2024; about the same as the year before. However, it also had US$363.3m in cash, and so its net debt is US$132.9m.
A Look At Angi's Liabilities
Zooming in on the latest balance sheet data, we can see that Angi had liabilities of US$242.2m due within 12 months and liabilities of US$549.7m due beyond that. On the other hand, it had cash of US$363.3m and US$60.8m worth of receivables due within a year. So its liabilities total US$367.8m more than the combination of its cash and short-term receivables.
While this might seem like a lot, it is not so bad since Angi has a market capitalization of US$1.11b, and so it could probably strengthen its balance sheet by raising capital if it needed to. But we definitely want to keep our eyes open to indications that its debt is bringing too much risk. The balance sheet is clearly the area to focus on when you are analysing debt. But it is future earnings, more than anything, that will determine Angi's ability to maintain a healthy balance sheet going forward. So if you want to see what the professionals think, you might find this free report on analyst profit forecasts to be interesting.
Over 12 months, Angi made a loss at the EBIT level, and saw its revenue drop to US$1.3b, which is a fall of 22%. That makes us nervous, to say the least.
Caveat Emptor
While Angi's falling revenue is about as heartwarming as a wet blanket, arguably its earnings before interest and tax (EBIT) loss is even less appealing. Indeed, it lost US$13m at the EBIT level. When we look at that and recall the liabilities on its balance sheet, relative to cash, it seems unwise to us for the company to have any debt. So we think its balance sheet is a little strained, though not beyond repair. We would feel better if it turned its trailing twelve month loss of US$18m into a profit. In the meantime, we consider the stock very risky. For riskier companies like Angi I always like to keep an eye on the long term profit and revenue trends. Fortunately, you can click to see our interactive graph of its profit, revenue, and operating cashflow.
If, after all that, you're more interested in a fast growing company with a rock-solid balance sheet, then check out our list of net cash growth stocks without delay.
New: Manage All Your Stock Portfolios in One Place
We've created the ultimate portfolio companion for stock investors, and it's free.
• Connect an unlimited number of Portfolios and see your total in one currency
• Be alerted to new Warning Signs or Risks via email or mobile
• Track the Fair Value of your stocks
Have feedback on this article? Concerned about the content? Get in touch with us directly. Alternatively, email editorial-team (at) simplywallst.com.
This article by Simply Wall St is general in nature. We provide commentary based on historical data and analyst forecasts only using an unbiased methodology and our articles are not intended to be financial advice. It does not constitute a recommendation to buy or sell any stock, and does not take account of your objectives, or your financial situation. We aim to bring you long-term focused analysis driven by fundamental data. Note that our analysis may not factor in the latest price-sensitive company announcements or qualitative material. Simply Wall St has no position in any stocks mentioned.
About NasdaqGS:ANGI
Angi
Angi Inc. connects home professionals with consumers in the United States and internationally.
Undervalued with excellent balance sheet.
Similar Companies
Market Insights

Advertisement
Community Narratives
MINISO's fair value is projected at 26.69 with an anticipated PE ratio shift of 20x
Fair Value US$24.03|11.0% undervalued
BE
Community Contributor
Procter & Gamble: A Dividend Giant Facing Slowing Growth
Fair Value US$119.81|23.3% overvalued
AN
Community Contributor
Eli Lilly's Future Growth Driven by Tirzepatide and Favorable Market Conditions
Fair Value US$1.19k|13.8% undervalued
EA
Community Contributor