

Howard Marks put it nicely when he said that, rather than worrying about share price volatility, 'The possibility of permanent loss is the risk I worry about... and every practical investor I know worries about.' It's only natural to consider a company's balance sheet when you examine how risky it is, since debt is often involved when a business collapses. Importantly, Newmont Corporation (NYSE:NEM) does carry debt. But the more important question is: how much risk is that debt creating?
When Is Debt A Problem?
Debt is a tool to help businesses grow, but if a business is incapable of paying off its lenders, then it exists at their mercy. Ultimately, if the company can't fulfill its legal obligations to repay debt, shareholders could walk away with nothing. However, a more usual (but still expensive) situation is where a company must dilute shareholders at a cheap share price simply to get debt under control. By replacing dilution, though, debt can be an extremely good tool for businesses that need capital to invest in growth at high rates of return. The first thing to do when considering how much debt a business uses is to look at its cash and debt together.
Check out our latest analysis for Newmont
What Is Newmont's Net Debt?
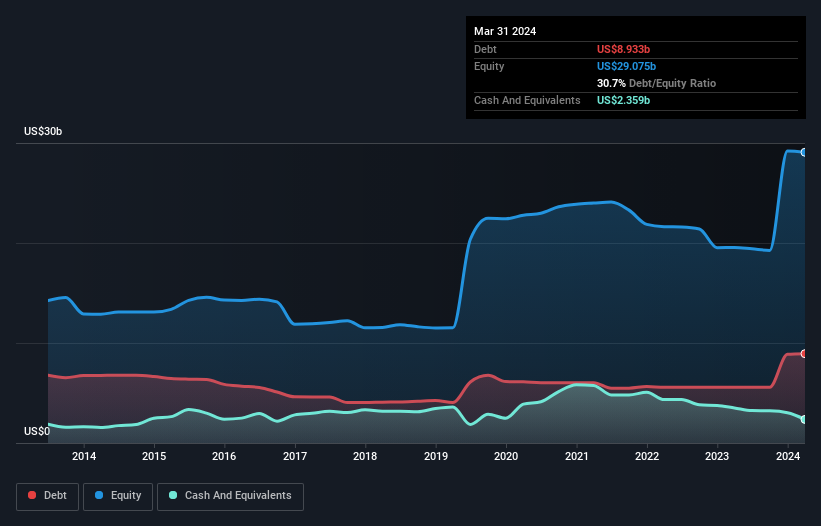
You can click the graphic below for the historical numbers, but it shows that as of March 2024 Newmont had US$8.93b of debt, an increase on US$5.57b, over one year. However, it does have US$2.36b in cash offsetting this, leading to net debt of about US$6.57b.
How Strong Is Newmont's Balance Sheet?
According to the last reported balance sheet, Newmont had liabilities of US$5.48b due within 12 months, and liabilities of US$20.8b due beyond 12 months. Offsetting this, it had US$2.36b in cash and US$782.0m in receivables that were due within 12 months. So its liabilities total US$23.1b more than the combination of its cash and short-term receivables.
This deficit isn't so bad because Newmont is worth a massive US$48.3b, and thus could probably raise enough capital to shore up its balance sheet, if the need arose. But it's clear that we should definitely closely examine whether it can manage its debt without dilution.
We measure a company's debt load relative to its earnings power by looking at its net debt divided by its earnings before interest, tax, depreciation, and amortization (EBITDA) and by calculating how easily its earnings before interest and tax (EBIT) cover its interest expense (interest cover). Thus we consider debt relative to earnings both with and without depreciation and amortization expenses.
Newmont's net debt of 1.8 times EBITDA suggests graceful use of debt. And the fact that its trailing twelve months of EBIT was 9.6 times its interest expenses harmonizes with that theme. The bad news is that Newmont saw its EBIT decline by 10% over the last year. If earnings continue to decline at that rate then handling the debt will be more difficult than taking three children under 5 to a fancy pants restaurant. The balance sheet is clearly the area to focus on when you are analysing debt. But ultimately the future profitability of the business will decide if Newmont can strengthen its balance sheet over time. So if you want to see what the professionals think, you might find this free report on analyst profit forecasts to be interesting.
But our final consideration is also important, because a company cannot pay debt with paper profits; it needs cold hard cash. So we clearly need to look at whether that EBIT is leading to corresponding free cash flow. Over the most recent three years, Newmont recorded free cash flow worth 76% of its EBIT, which is around normal, given free cash flow excludes interest and tax. This free cash flow puts the company in a good position to pay down debt, when appropriate.
Our View
Newmont's conversion of EBIT to free cash flow was a real positive on this analysis, as was its interest cover. On the other hand, its EBIT growth rate makes us a little less comfortable about its debt. Looking at all this data makes us feel a little cautious about Newmont's debt levels. While debt does have its upside in higher potential returns, we think shareholders should definitely consider how debt levels might make the stock more risky. When analysing debt levels, the balance sheet is the obvious place to start. However, not all investment risk resides within the balance sheet - far from it. We've identified 2 warning signs with Newmont (at least 1 which is a bit concerning) , and understanding them should be part of your investment process.
When all is said and done, sometimes its easier to focus on companies that don't even need debt. Readers can access a list of growth stocks with zero net debt 100% free, right now.
Valuation is complex, but we're here to simplify it.
Discover if Newmont might be undervalued or overvalued with our detailed analysis, featuring fair value estimates, potential risks, dividends, insider trades, and its financial condition.
Access Free AnalysisHave feedback on this article? Concerned about the content? Get in touch with us directly. Alternatively, email editorial-team (at) simplywallst.com.
This article by Simply Wall St is general in nature. We provide commentary based on historical data and analyst forecasts only using an unbiased methodology and our articles are not intended to be financial advice. It does not constitute a recommendation to buy or sell any stock, and does not take account of your objectives, or your financial situation. We aim to bring you long-term focused analysis driven by fundamental data. Note that our analysis may not factor in the latest price-sensitive company announcements or qualitative material. Simply Wall St has no position in any stocks mentioned.
About NYSE:NEM
Excellent balance sheet and good value.
