Advertisement
- United States
- /
- Metals and Mining
- /
- NYSE:NEM
Is Newmont’s 131.7% Surge in 2025 Reflecting the Company’s True Value?

Simply Wall St
Reviewed by Bailey Pemberton
If you are staring at Newmont’s ticker and wondering whether now is the moment to buy, sell, or just hold tight, you are not alone. After a whirlwind year, Newmont’s stock has left investors with a lot to process. The share price recently closed at $88.91, which is eye-catching when you look at the wild swings. It is up an impressive 131.7% year-to-date and a solid 84.1% higher than it was twelve months ago. Even the past three years show gains of over 125%. That said, the past week saw a pullback of -9.5%, giving some investors pause and raising questions about what lies ahead.
Recent headlines have been a steady drumbeat in the background, especially as Newmont continues to solidify its position as the world’s largest gold producer. Market chatter around global economic uncertainty and inflation has fueled enthusiasm for gold stocks, sending money flowing toward sector leaders like Newmont. The company’s strategic acquisitions and renewed focus on cost efficiency have also played a role in buoying sentiment. Not every headline has been equally impactful, but the broader context suggests a shifting risk appetite among investors.
As for value, Newmont currently lands a valuation score of 3 out of 6, meaning it checks the box as undervalued in half of the metrics analysts commonly watch. But what does this mean for you as a potential investor? The landscape of valuation approaches can be confusing, but do not worry. In the next section, we will break down the different frameworks analysts use to value Newmont and, ultimately, explore the one that might give you the clearest picture.
Approach 1: Newmont Discounted Cash Flow (DCF) Analysis
The Discounted Cash Flow (DCF) model is a widely used valuation method that estimates the present value of a company by projecting its future cash flows and discounting them back to today. Essentially, it answers the question: what should Newmont’s stock be worth, based on the cash it is expected to generate over many years?
For Newmont, the latest reported Free Cash Flow (FCF) stands at $4.7 billion. Analyst estimates suggest this figure will gradually grow, with projections reaching $4.99 billion by 2029. Over the next decade, Simply Wall St extrapolates these estimates, with cash flows expected to fluctuate in a tight range, rising above $7 billion in 2026 and then moderating to around $4.7 billion by 2035. All projections are in dollars.
After running these projections through a 2 Stage Free Cash Flow to Equity model, Newmont’s intrinsic value comes out to $81.93 per share. With the current market price at $88.91, the DCF model suggests the stock is around 8.5% overvalued. However, that margin is relatively slim and could easily swing based on updated forecasts or market moves.
Result: ABOUT RIGHT

Simply Wall St performs a valuation analysis on every stock in the world every day (check out Newmont's valuation analysis). We show the entire calculation in full. You can track the result in your watchlist or portfolio and be alerted when this changes.
Approach 2: Newmont Price vs Earnings
The Price-to-Earnings (PE) ratio is one of the most widely used valuation metrics for profitable companies like Newmont. It tells you how much investors are willing to pay today for each dollar of the company’s earnings, making it especially useful when ongoing profitability is proven. A lower PE can indicate a bargain, while a higher one may suggest either strong growth prospects or increased risk.
It is important to remember that what is considered a “normal” or “fair” PE ratio varies by industry, expected earnings growth, and the level of risk. Higher growth and lower risk often justify a steeper PE, while mature, lower-growth companies typically trade at lower ratios.
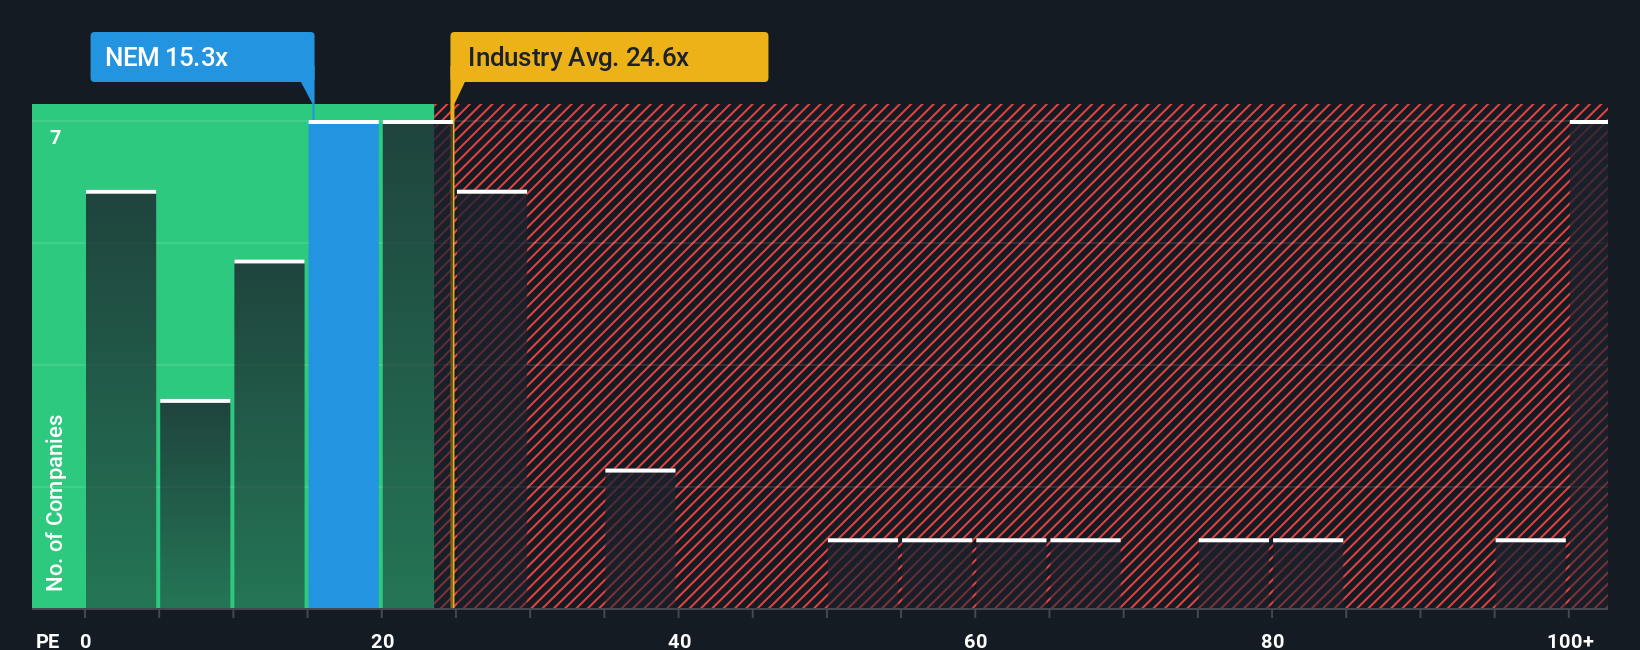
Newmont currently trades at a PE ratio of 15.6x. That is below both the Metals and Mining industry average of 24.3x and the average of its peers at 36.4x. In addition to simple averages, Simply Wall St’s “Fair Ratio” offers a nuanced benchmark by calculating what the multiple should be, taking into account factors specific to the company, such as its earnings growth, profit margin, risk level, industry trends, and even its market capitalization. For Newmont, the Fair Ratio is estimated at 25.5x. This means the stock is trading at a notable discount compared to where it might be valued given its fundamentals. Because the difference between the Fair Ratio and the actual PE is greater than 0.10, this suggests the stock is undervalued based on this approach.
Result: UNDERVALUED
PE ratios tell one story, but what if the real opportunity lies elsewhere? Discover companies where insiders are betting big on explosive growth.
Upgrade Your Decision Making: Choose your Newmont Narrative
Earlier, we mentioned that there is an even better way to approach valuation, so let’s introduce you to Narratives. Narratives are a smarter, more dynamic investment tool that lets you build your own story behind Newmont’s numbers by combining your beliefs about the company’s future revenues, earnings, and margins with a tailored fair value estimate.
Think of a Narrative as the link between the company’s story and its financial forecast. It brings together your unique perspective, translates it into future performance expectations, and shows what a fair share price might be. Narratives are available for easy use within the Simply Wall St Community page, making them accessible for investors at any experience level.
By matching your Narrative’s calculated Fair Value against the current market Price, you can make more informed buy or sell decisions grounded in your personal outlook, not just static analyst targets. What sets Narratives apart is that they automatically account for the latest news, earnings releases, and events, so your valuation updates as the story evolves.
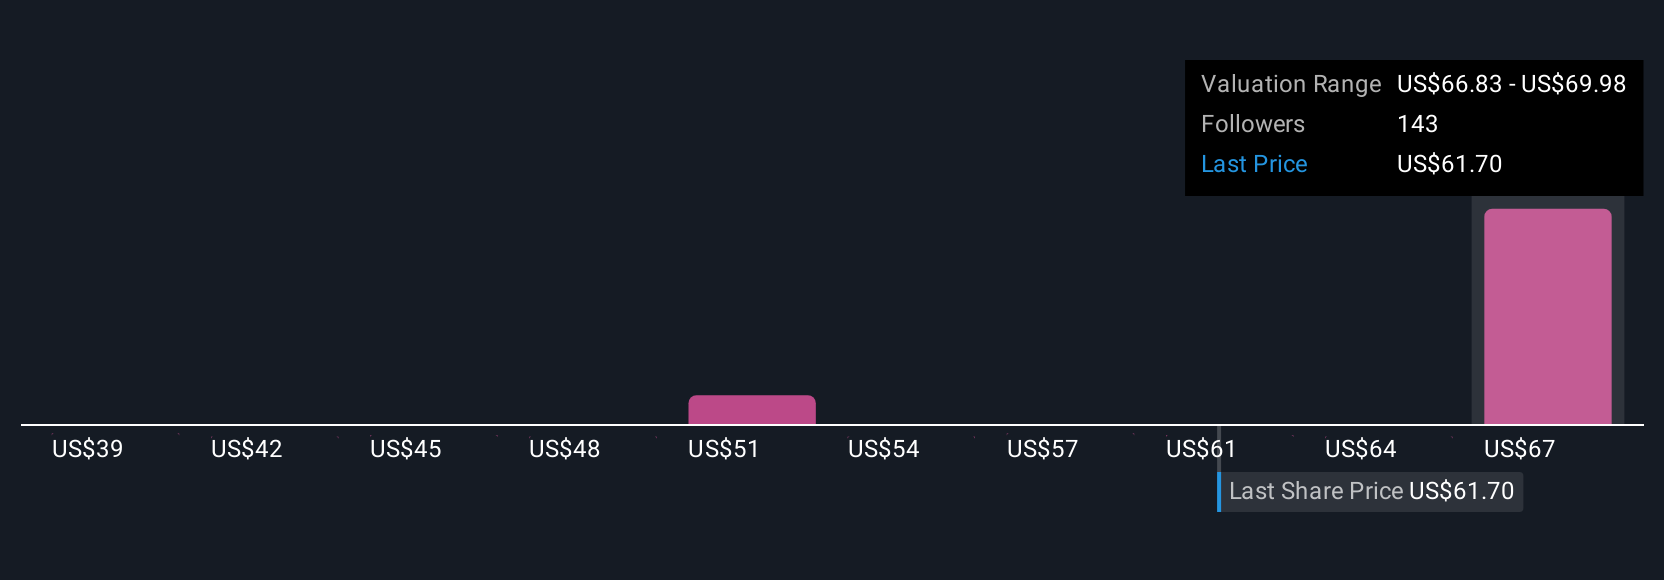
For example, some investors believe Newmont’s synergies and resilient gold demand justify a bull case with a Fair Value as high as $104.00, while others, more cautious about operational risks and costs, see a Fair Value closer to $58.00. Narratives empower you to see both options and decide where you stand.
Do you think there's more to the story for Newmont? Create your own Narrative to let the Community know!
This article by Simply Wall St is general in nature. We provide commentary based on historical data and analyst forecasts only using an unbiased methodology and our articles are not intended to be financial advice. It does not constitute a recommendation to buy or sell any stock, and does not take account of your objectives, or your financial situation. We aim to bring you long-term focused analysis driven by fundamental data. Note that our analysis may not factor in the latest price-sensitive company announcements or qualitative material. Simply Wall St has no position in any stocks mentioned.
Valuation is complex, but we're here to simplify it.
Discover if Newmont might be undervalued or overvalued with our detailed analysis, featuring fair value estimates, potential risks, dividends, insider trades, and its financial condition.
Access Free AnalysisHave feedback on this article? Concerned about the content? Get in touch with us directly. Alternatively, email editorial-team@simplywallst.com
About NYSE:NEM
Very undervalued with excellent balance sheet.
Similar Companies
Market Insights

Advertisement
Community Narratives
The company that turned a verb into a global necessity and basically runs the modern internet, digital ads, smartphones, maps, and AI.
Fair Value US$300.00|6.3% undervalued
OS
Community Contributor
Flowers Foods Pays A Fair Price For Health
Fair Value US$16.12|26.0% undervalued
NV
Community Contributor
TMX Group will thrive with 33.3% profit margin and enduring market moat
Fair Value CA$49.90|3.7% overvalued
LI
Community Contributor