Stock Analysis
- United States
- /
- Metals and Mining
- /
- NYSE:NEM
Is Newmont (NYSE:NEM) A Risky Investment?

Warren Buffett famously said, 'Volatility is far from synonymous with risk.' It's only natural to consider a company's balance sheet when you examine how risky it is, since debt is often involved when a business collapses. We note that Newmont Corporation (NYSE:NEM) does have debt on its balance sheet. But the more important question is: how much risk is that debt creating?
When Is Debt Dangerous?
Generally speaking, debt only becomes a real problem when a company can't easily pay it off, either by raising capital or with its own cash flow. If things get really bad, the lenders can take control of the business. However, a more common (but still painful) scenario is that it has to raise new equity capital at a low price, thus permanently diluting shareholders. By replacing dilution, though, debt can be an extremely good tool for businesses that need capital to invest in growth at high rates of return. The first step when considering a company's debt levels is to consider its cash and debt together.
See our latest analysis for Newmont
What Is Newmont's Net Debt?
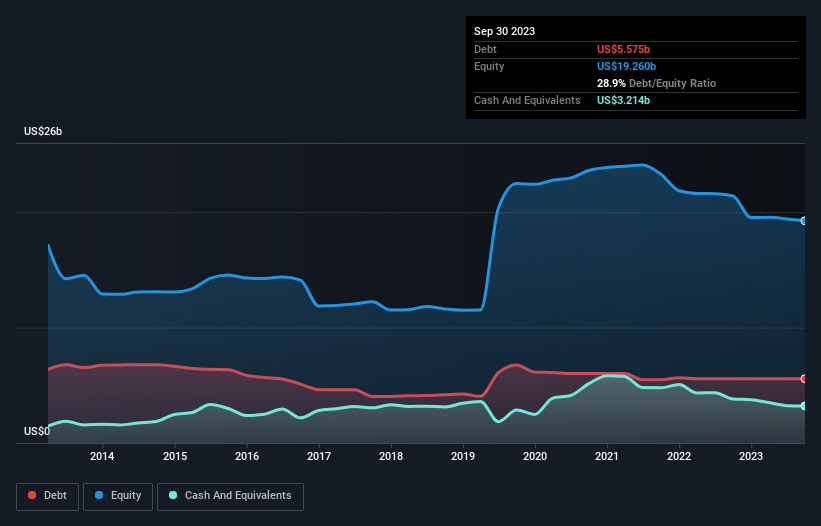
The chart below, which you can click on for greater detail, shows that Newmont had US$5.58b in debt in September 2023; about the same as the year before. However, it does have US$3.21b in cash offsetting this, leading to net debt of about US$2.36b.
How Healthy Is Newmont's Balance Sheet?
The latest balance sheet data shows that Newmont had liabilities of US$2.81b due within a year, and liabilities of US$16.0b falling due after that. On the other hand, it had cash of US$3.21b and US$78.0m worth of receivables due within a year. So its liabilities total US$15.5b more than the combination of its cash and short-term receivables.
Newmont has a very large market capitalization of US$46.1b, so it could very likely raise cash to ameliorate its balance sheet, if the need arose. But we definitely want to keep our eyes open to indications that its debt is bringing too much risk.
We measure a company's debt load relative to its earnings power by looking at its net debt divided by its earnings before interest, tax, depreciation, and amortization (EBITDA) and by calculating how easily its earnings before interest and tax (EBIT) cover its interest expense (interest cover). The advantage of this approach is that we take into account both the absolute quantum of debt (with net debt to EBITDA) and the actual interest expenses associated with that debt (with its interest cover ratio).
Newmont's net debt is only 0.71 times its EBITDA. And its EBIT easily covers its interest expense, being 15.4 times the size. So we're pretty relaxed about its super-conservative use of debt. Fortunately, Newmont grew its EBIT by 5.2% in the last year, making that debt load look even more manageable. There's no doubt that we learn most about debt from the balance sheet. But it is future earnings, more than anything, that will determine Newmont's ability to maintain a healthy balance sheet going forward. So if you want to see what the professionals think, you might find this free report on analyst profit forecasts to be interesting.
Finally, while the tax-man may adore accounting profits, lenders only accept cold hard cash. So we always check how much of that EBIT is translated into free cash flow. During the last three years, Newmont generated free cash flow amounting to a very robust 90% of its EBIT, more than we'd expect. That positions it well to pay down debt if desirable to do so.
Our View
Newmont's interest cover suggests it can handle its debt as easily as Cristiano Ronaldo could score a goal against an under 14's goalkeeper. And the good news does not stop there, as its conversion of EBIT to free cash flow also supports that impression! When we consider the range of factors above, it looks like Newmont is pretty sensible with its use of debt. That means they are taking on a bit more risk, in the hope of boosting shareholder returns. When analysing debt levels, the balance sheet is the obvious place to start. But ultimately, every company can contain risks that exist outside of the balance sheet. Case in point: We've spotted 2 warning signs for Newmont you should be aware of, and 1 of them can't be ignored.
If you're interested in investing in businesses that can grow profits without the burden of debt, then check out this free list of growing businesses that have net cash on the balance sheet.
Valuation is complex, but we're helping make it simple.
Find out whether Newmont is potentially over or undervalued by checking out our comprehensive analysis, which includes fair value estimates, risks and warnings, dividends, insider transactions and financial health.
View the Free AnalysisHave feedback on this article? Concerned about the content? Get in touch with us directly. Alternatively, email editorial-team (at) simplywallst.com.
This article by Simply Wall St is general in nature. We provide commentary based on historical data and analyst forecasts only using an unbiased methodology and our articles are not intended to be financial advice. It does not constitute a recommendation to buy or sell any stock, and does not take account of your objectives, or your financial situation. We aim to bring you long-term focused analysis driven by fundamental data. Note that our analysis may not factor in the latest price-sensitive company announcements or qualitative material. Simply Wall St has no position in any stocks mentioned.
About NYSE:NEM
Newmont
Newmont Corporation engages in the production and exploration of gold.
Excellent balance sheet with reasonable growth potential.

