Advertisement
- United States
- /
- Metals and Mining
- /
- NYSE:NEM
Is Newmont Attractively Priced After a Wild 114.5% Rally in 2025?

Simply Wall St
Reviewed by Bailey Pemberton
- Thinking about adding Newmont to your portfolio but not sure if the current price is a bargain or a trap? You are not alone. A lot of investors are keeping a close eye on its valuation right now.
- Newmont’s share price has been on a wild ride, up a stunning 114.5% year to date and boasting an 84.8% gain over the last 12 months, but it has also seen sharp drops, such as a -7.4% decline in just the last week.
- Much of this volatility is tied to shifting sentiment in the gold market and heightened activity among major miners. Recent headlines about gold price surges, merger talks in the sector, and central banks increasing their gold reserves have pushed Newmont’s stock into the spotlight, creating both buzz and uncertainty for investors.
- With a valuation score of 6 out of 6, Newmont looks promising on paper, but let’s dive deeper into the numbers and see how different valuation methods measure up. The real value story might go beyond standard models by the end of this article.
Approach 1: Newmont Discounted Cash Flow (DCF) Analysis
The Discounted Cash Flow (DCF) model estimates the value of a company by forecasting its future cash flows and discounting them back to their present value. This method aims to capture the intrinsic worth of a business by focusing on its ability to generate cash in the future.
For Newmont, analysts estimate that the company currently generates around $5.34 billion in Free Cash Flow (FCF). Over the next several years, expert forecasts and model extrapolations suggest steady growth, with FCF potentially reaching $7.56 billion by 2029. Projections indicate further increases in the years that follow. The primary DCF model used here is the Two-Stage Free Cash Flow to Equity model, which incorporates both a growth phase and a stable phase when considering future cash flow.
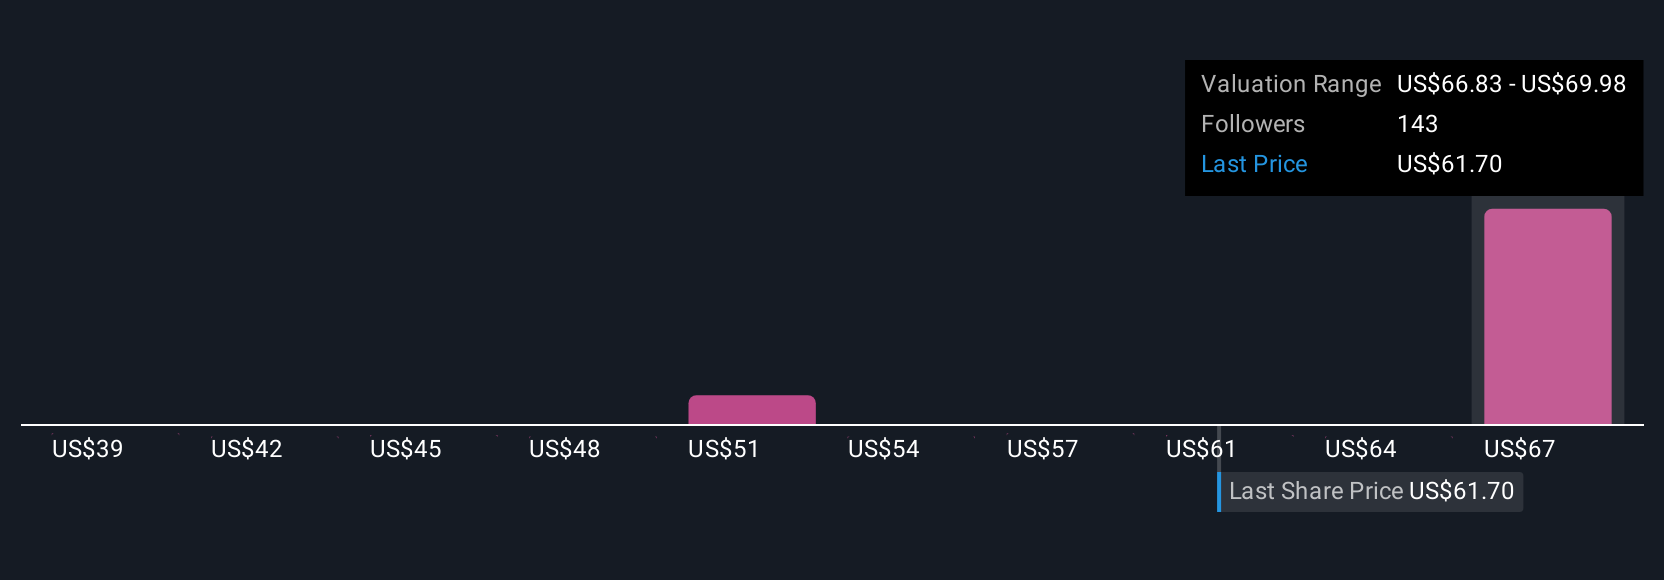
The results are notable. Based on these projections, Newmont’s estimated intrinsic value is $124.95 per share. This intrinsic value is 34.1 percent above the current market price, suggesting the stock may be significantly undervalued if these cash flow assumptions are realized.
Result: UNDERVALUED
Our Discounted Cash Flow (DCF) analysis suggests Newmont is undervalued by 34.1%. Track this in your watchlist or portfolio, or discover 831 more undervalued stocks based on cash flows.

Approach 2: Newmont Price vs Earnings
For companies like Newmont that are consistently profitable, the Price-to-Earnings (PE) ratio is a tried-and-true way of measuring valuation. The PE ratio takes the company’s current share price and divides it by its earnings per share, offering a snapshot of how much investors are paying for each dollar of earnings. It is especially useful for established firms, as it reflects both their current profitability and the market’s growth expectations.
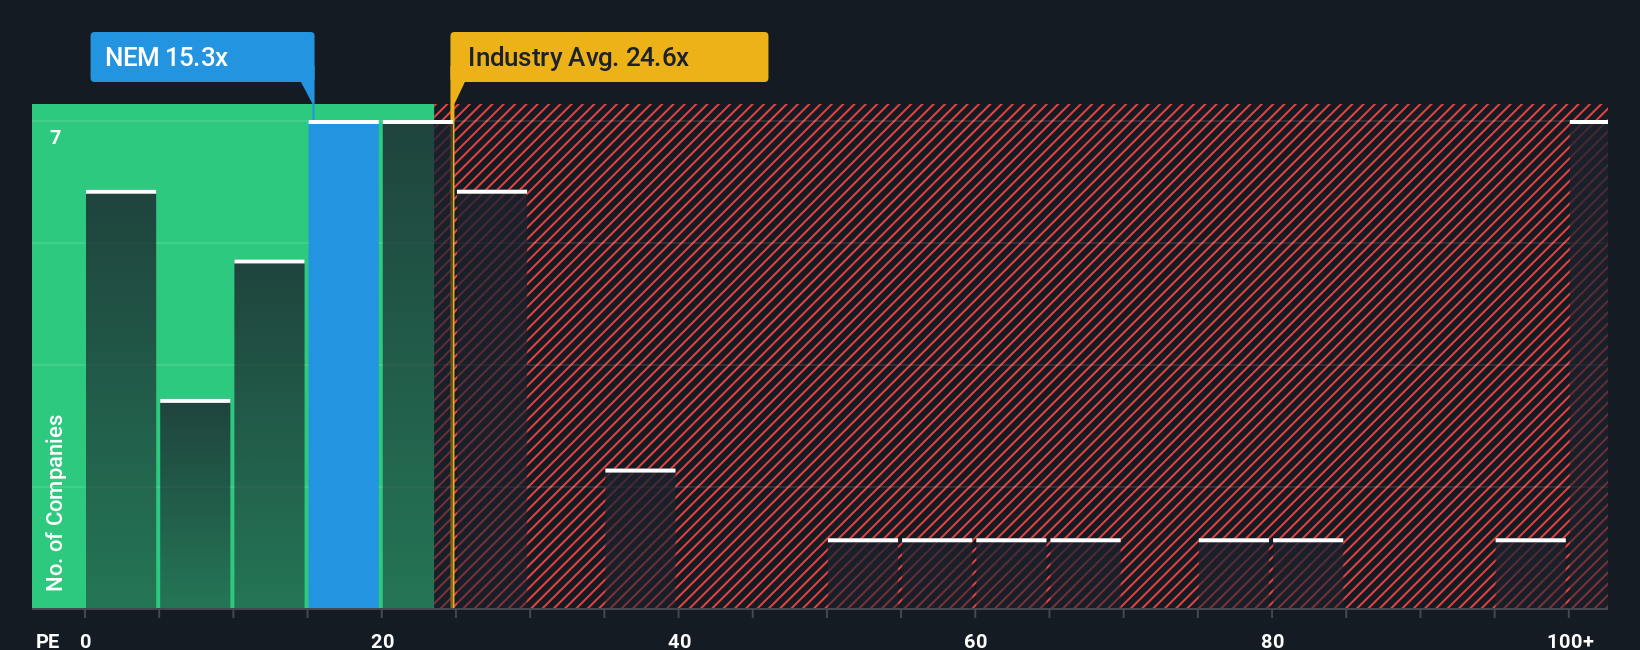
Growth prospects and risk levels heavily shape what counts as a “fair” PE ratio. High-growth companies, or those with lower risk, typically command higher PE multiples as investors are willing to pay more for future profits. For Newmont, the current PE stands at 12.5x, which is a marked discount compared to the Metals and Mining industry average of 24.3x and leading peer companies averaging 26.1x.
Beyond these basic comparisons, Simply Wall St calculates a “Fair Ratio” of 25.4x for Newmont. This proprietary metric goes a step further by accounting for factors such as the company’s expected earnings growth, profit margins, market cap, and sector-specific risks. It provides a more nuanced perspective than simply comparing with industry or peer averages, recognizing that every company’s circumstances are unique.
With Newmont’s actual PE ratio well below its Fair Ratio, the numbers suggest the stock is trading at a significant discount relative to its fundamentals and risk profile.
Result: UNDERVALUED
PE ratios tell one story, but what if the real opportunity lies elsewhere? Discover 1394 companies where insiders are betting big on explosive growth.
Upgrade Your Decision Making: Choose your Newmont Narrative
Earlier, we mentioned that there is an even better way to understand valuation, so let us introduce you to Narratives. A Narrative is your personal investment story, putting your perspective behind the numbers by shaping the fair value and the estimates you believe for a company’s future revenue, earnings, and margins. Instead of just relying on standard ratios and general market sentiment, Narratives connect a company’s unique story to a financial forecast and then to a clear fair value tailored to your outlook.
Narratives are an easy tool available on Simply Wall St’s Community page, used by millions of investors of all experience levels. They help you decide whether to buy or sell by letting you compare your fair value against the current market price, while dynamically updating your view whenever new information, such as earnings or major news, is published. For example, on Newmont, bullish investors in the Community see gold demand and efficiency drives supporting a fair value near $104 per share, while the most cautious see risks outweighing upside, justifying values closer to $58. Narratives let you capture your reasoning and act with confidence as market realities evolve.
Do you think there's more to the story for Newmont? Head over to our Community to see what others are saying!
This article by Simply Wall St is general in nature. We provide commentary based on historical data and analyst forecasts only using an unbiased methodology and our articles are not intended to be financial advice. It does not constitute a recommendation to buy or sell any stock, and does not take account of your objectives, or your financial situation. We aim to bring you long-term focused analysis driven by fundamental data. Note that our analysis may not factor in the latest price-sensitive company announcements or qualitative material. Simply Wall St has no position in any stocks mentioned.
Valuation is complex, but we're here to simplify it.
Discover if Newmont might be undervalued or overvalued with our detailed analysis, featuring fair value estimates, potential risks, dividends, insider trades, and its financial condition.
Access Free AnalysisHave feedback on this article? Concerned about the content? Get in touch with us directly. Alternatively, email editorial-team@simplywallst.com
About NYSE:NEM
Very undervalued with excellent balance sheet.
Similar Companies
Market Insights

Advertisement
Community Narratives
The company that turned a verb into a global necessity and basically runs the modern internet, digital ads, smartphones, maps, and AI.
Fair Value US$300.00|6.2% undervalued
OS
Community Contributor
Flowers Foods Pays A Fair Price For Health
Fair Value US$16.12|25.1% undervalued
NV
Community Contributor
TMX Group will thrive with 33.3% profit margin and enduring market moat
Fair Value CA$49.90|0.04% overvalued
LI
Community Contributor