Advertisement
- United States
- /
- Metals and Mining
- /
- NYSE:DRD
A Look at DRDGOLD (NYSE:DRD) Valuation Following Leadership Change and Strategic Growth Initiative

Simply Wall St
Reviewed by Simply Wall St
DRDGOLD (NYSE:DRD) just revealed a leadership transition along with an accelerated R8 billion growth initiative. The company plans to expand its operations and strengthen its market position in the gold mining sector with this move.
See our latest analysis for DRDGOLD.
DRDGOLD’s recent leadership shakeup and ambitious growth plan have caught investor attention, helping fuel incredible momentum. The stock's up 193.57% for its year-to-date share price return and has delivered a 177.93% total shareholder return over the past year. With these gains, DRD is showing the kind of strong performance that suggests real growth expectations are being priced in for both the near and longer term.
If you’re searching for your next big opportunity in dynamic markets, now’s a perfect time to expand your horizons and discover fast growing stocks with high insider ownership
But with shares soaring and future growth plans making headlines, investors must ask: is DRDGOLD still trading at an attractive valuation, or has the market already factored in all its growth potential?
Price-to-Earnings of 17.8x: Is it justified?
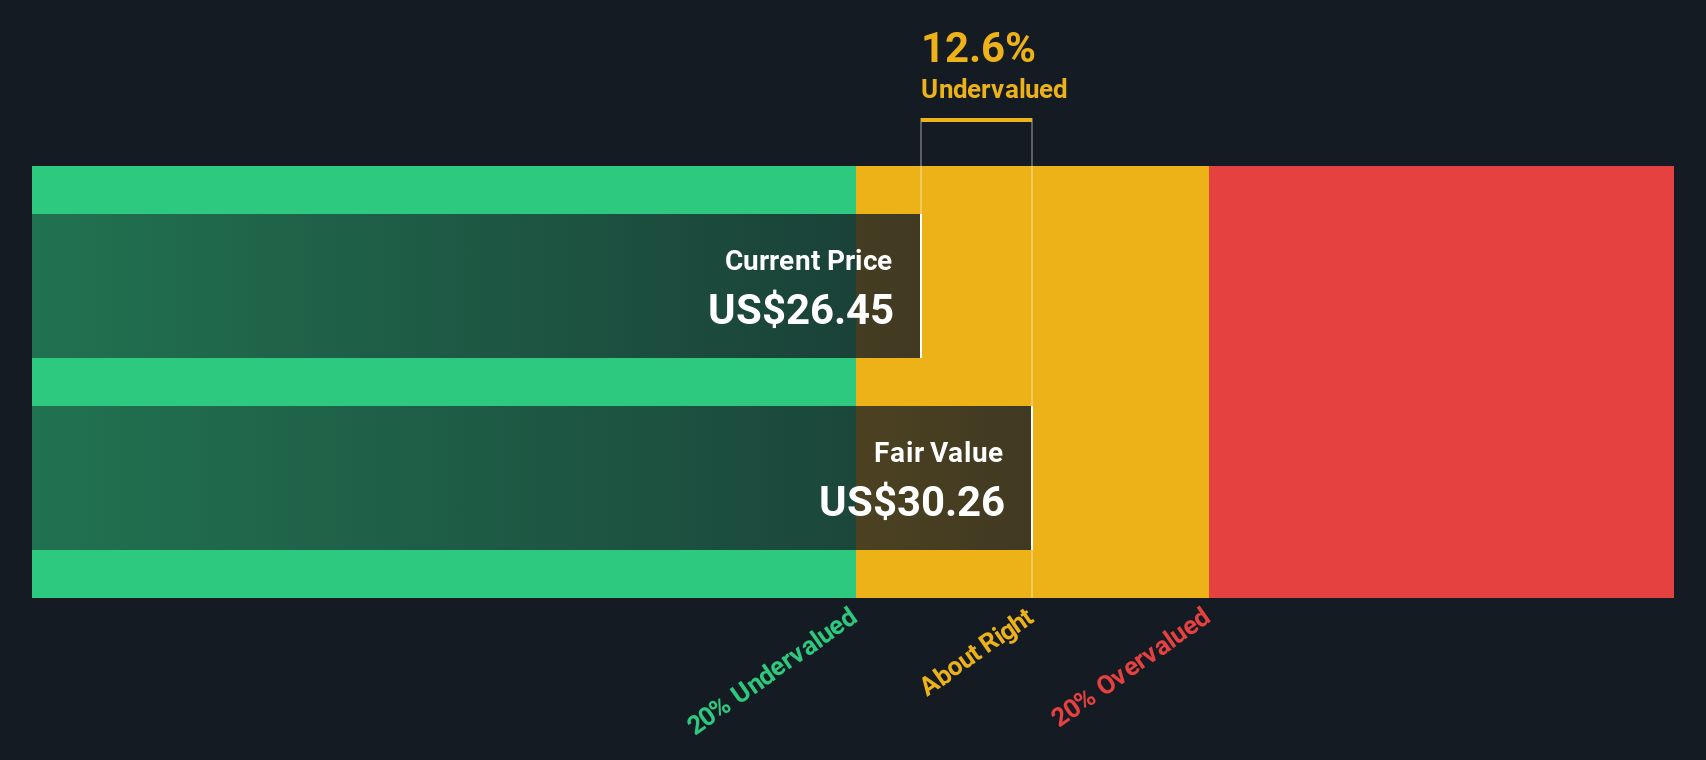
With DRDGOLD trading at a price-to-earnings (P/E) ratio of 17.8x, the stock stands out as attractively valued compared to both the US Metals and Mining industry and its direct peers. The last close was $26.48, while peer averages and industry multiples are noticeably higher, reinforcing the undervaluation narrative.
The price-to-earnings ratio measures the price investors are willing to pay today for one dollar of current earnings. For a mining company experiencing meaningful growth in top and bottom line figures, a reasonable or discounted P/E can suggest the market is undervaluing future earnings power.
DRDGOLD’s P/E of 17.8x is lower than the US Metals and Mining industry average of 21.2x and also below its peer average of 19.6x. This points to a potential market disconnect, as investors may not be fully pricing in DRDGOLD’s exceptional growth and margin profile compared to its sector.
See what the numbers say about this price — find out in our valuation breakdown.
Result: Price-to-Earnings of 17.8x (UNDERVALUED)
However, global gold price volatility and execution risks tied to ambitious growth plans could quickly reverse DRDGOLD’s recent upside and market optimism.
Find out about the key risks to this DRDGOLD narrative.
Another View: What Does the SWS DCF Model Reveal?
Looking beyond the price-to-earnings ratio, our SWS DCF model estimates DRDGOLD's fair value at $47.89 per share, far above its current trading price of $26.48. This suggests the stock could be significantly undervalued. However, it is important to consider whether this projection holds up under changing market conditions.
Look into how the SWS DCF model arrives at its fair value.
Simply Wall St performs a discounted cash flow (DCF) on every stock in the world every day (check out DRDGOLD for example). We show the entire calculation in full. You can track the result in your watchlist or portfolio and be alerted when this changes, or use our stock screener to discover 926 undervalued stocks based on their cash flows. If you save a screener we even alert you when new companies match - so you never miss a potential opportunity.
Build Your Own DRDGOLD Narrative
If you have a different perspective or want to dig deeper into the numbers yourself, you can build your own take in just a few minutes. Do it your way
A great starting point for your DRDGOLD research is our analysis highlighting 3 key rewards and 1 important warning sign that could impact your investment decision.
Looking for more investment ideas?
Set yourself up for smarter investing moves by uncovering stocks that could outperform in today’s fast-moving market. Don’t let the next big opportunity slip by. Make your next step count and find companies with the right fundamentals now.
- Target high growth potential by browsing these 926 undervalued stocks based on cash flows, perfect for spotting undervalued stocks where market sentiment hasn’t caught up yet.
- Capitalize on emerging trends and unlock opportunities in AI by checking out these 26 AI penny stocks at the forefront of innovation.
- Strengthen your portfolio’s income with these 16 dividend stocks with yields > 3%, highlighting stocks offering yields above 3% for consistent returns.
This article by Simply Wall St is general in nature. We provide commentary based on historical data and analyst forecasts only using an unbiased methodology and our articles are not intended to be financial advice. It does not constitute a recommendation to buy or sell any stock, and does not take account of your objectives, or your financial situation. We aim to bring you long-term focused analysis driven by fundamental data. Note that our analysis may not factor in the latest price-sensitive company announcements or qualitative material. Simply Wall St has no position in any stocks mentioned.
New: Manage All Your Stock Portfolios in One Place
We've created the ultimate portfolio companion for stock investors, and it's free.
• Connect an unlimited number of Portfolios and see your total in one currency
• Be alerted to new Warning Signs or Risks via email or mobile
• Track the Fair Value of your stocks
Have feedback on this article? Concerned about the content? Get in touch with us directly. Alternatively, email editorial-team@simplywallst.com
About NYSE:DRD
DRDGOLD
A gold mining company, engages in the extraction of gold from the retreatment of surface mine tailings in South Africa.
Outstanding track record with excellent balance sheet and pays a dividend.
Similar Companies
Market Insights

Advertisement
Community Narratives
MicroVision will explode future revenue by 380.37% with a vision towards success
Fair Value US$60.00|98.4% undervalued
TH
Community Contributor
The Indispensable Artery for a New North American Economy
Fair Value CA$132.87|1.3% undervalued
TI
Community Contributor