Advertisement
- United States
- /
- Packaging
- /
- NYSE:AMCR
Are Recent Sustainable Packaging Headlines a Turning Point for Amcor Shares?

Simply Wall St
Reviewed by Bailey Pemberton
- Wondering if Amcor is a hidden value opportunity or a value trap? You are not alone, especially with so much debate around packaging stocks these days.
- The share price has dipped by 5.7% over the past week and is down 3.8% in the last month. This continues a year-to-date slide of 15.8%, which may have caught the eye of bargain hunters or cautious investors alike.
- Amcor has been in the headlines recently as global packaging trends shift and increased focus on sustainable solutions impacts sentiment. These industry changes, along with competitive developments, have sparked new questions about where Amcor fits in the evolving landscape and what that might mean for its future share price.
- Currently, Amcor sits at a 2 out of 6 valuation score. This suggests that much of its potential upside and risk may depend on how you interpret its value. Ahead, we will examine several valuation approaches, so make sure to stick around for a perspective on valuation that every long-term investor should consider.
Amcor scores just 2/6 on our valuation checks. See what other red flags we found in the full valuation breakdown.
Approach 1: Amcor Discounted Cash Flow (DCF) Analysis
The Discounted Cash Flow (DCF) model estimates a company's intrinsic value by forecasting its future free cash flows and then discounting those amounts back to today's dollar value. This approach helps investors gauge what a business is fundamentally worth, regardless of daily market swings.
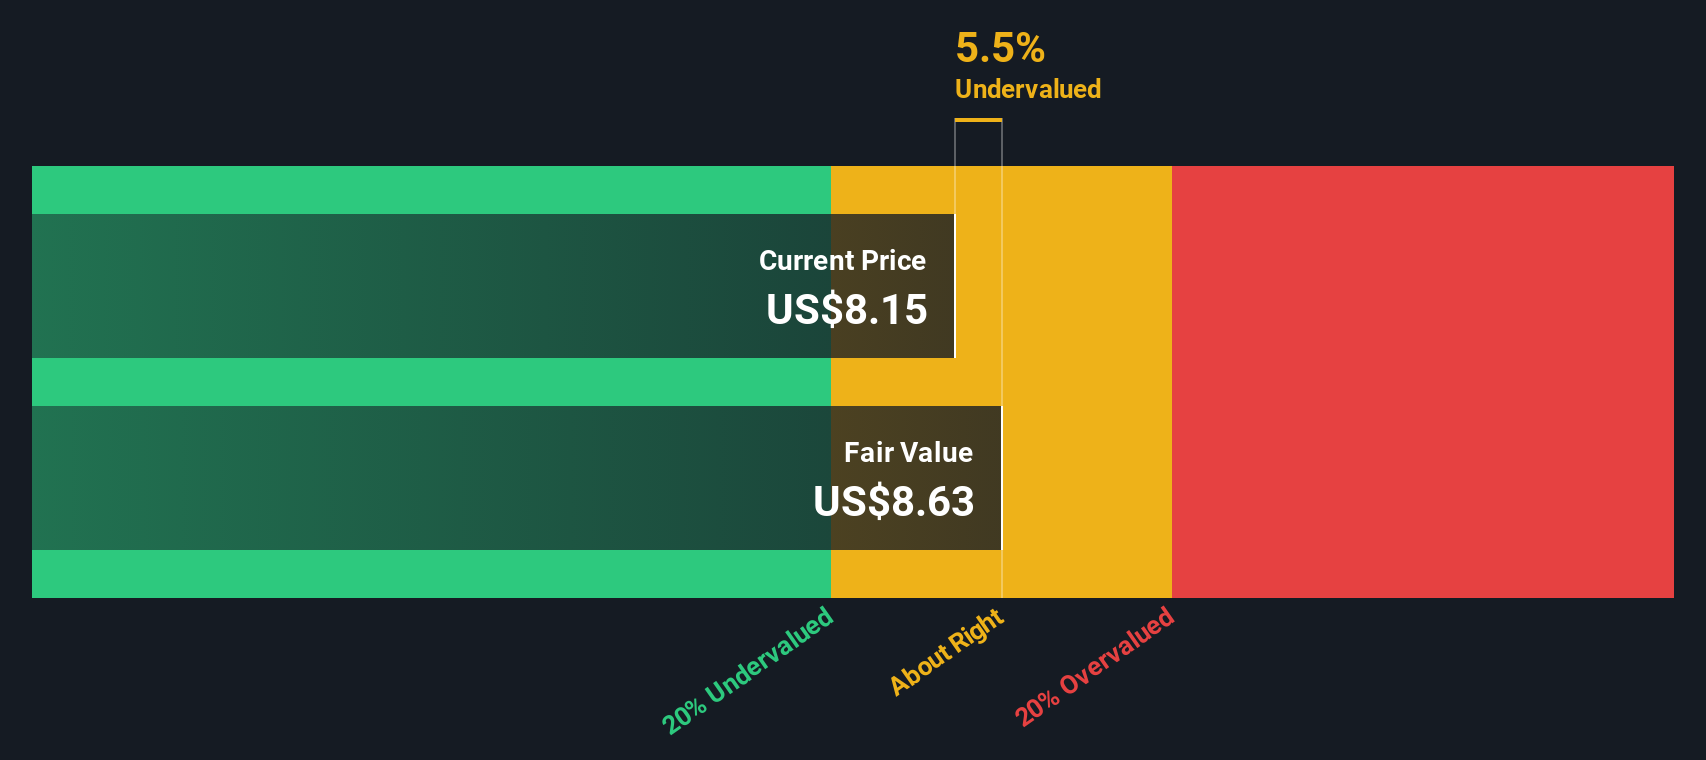
For Amcor, the latest reported Free Cash Flow stands at $836.6 Million. Analyst estimates look ahead around five years and project increasing cash flow before longer-term numbers are extrapolated by Simply Wall St. According to these projections, Amcor could be generating $959 Million in free cash flow by 2035. These forecasts, together with the discounted value of future cash flows, result in a calculated fair value of $8.86 per share.
Comparing that estimated value to the current share price suggests Amcor is trading at an 11.1% discount. As a result, the stock appears undervalued based on DCF analysis. Investors who look for potential bargains may see this as an attractive entry point.
Result: UNDERVALUED
Our Discounted Cash Flow (DCF) analysis suggests Amcor is undervalued by 11.1%. Track this in your watchlist or portfolio, or discover 844 more undervalued stocks based on cash flows.
Approach 2: Amcor Price vs Earnings
The price-to-earnings (PE) ratio is widely used to value profitable companies because it ties a company’s market value directly to its bottom-line earnings. For businesses like Amcor, which consistently generate profits, the PE ratio helps investors quickly see how much they are paying for each dollar of earnings compared to industry peers and the market as a whole.
What counts as a reasonable or “fair” PE ratio depends on factors like anticipated earnings growth and risk. Companies expected to expand quickly or with lower risk typically justify higher multiples, while slower growth or greater uncertainty can mean a lower PE is warranted.
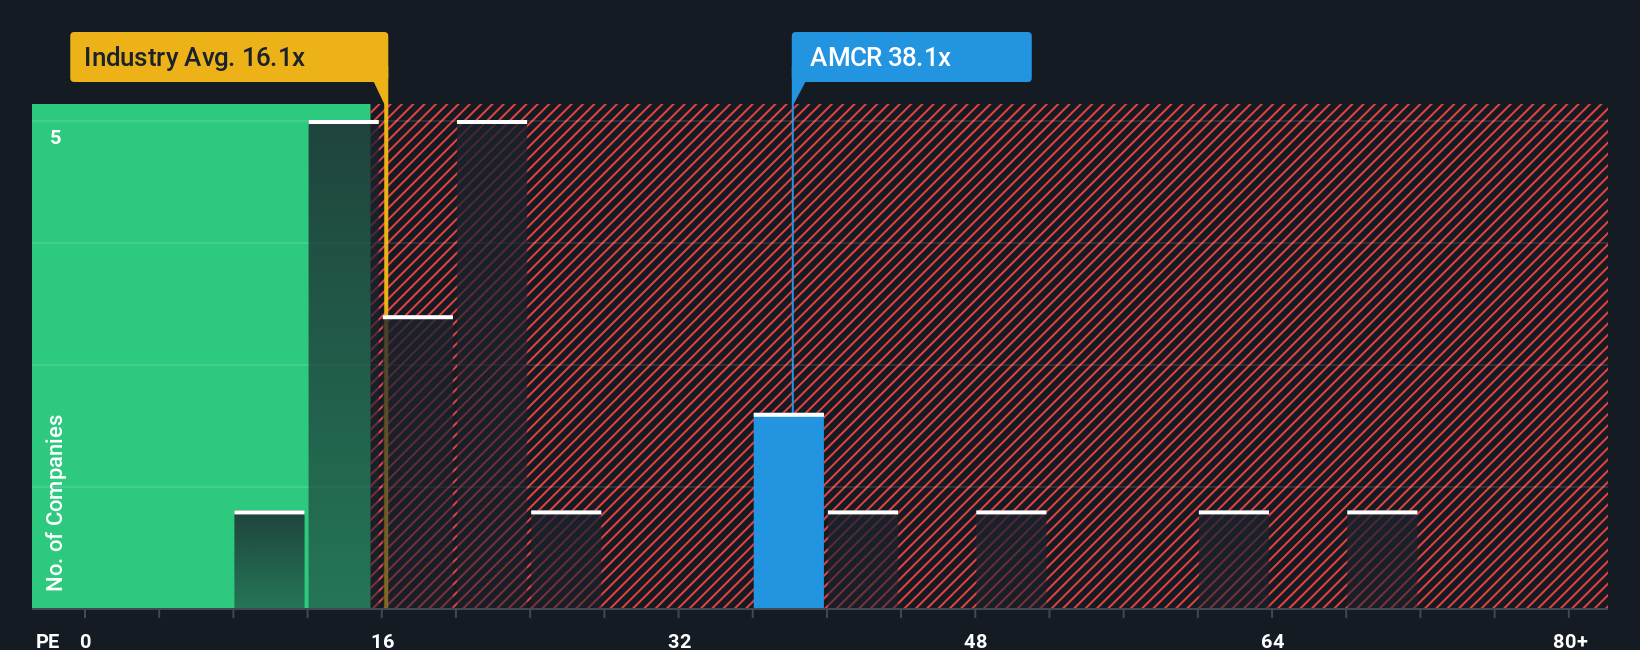
Currently, Amcor trades at a PE ratio of 35.6x. By comparison, the average PE for its Packaging industry peers is 16.0x, and the peer group average is 19.4x. This places Amcor well above these common benchmarks, which may indicate the market is pricing in higher growth, better quality, or lower risk than average.
Simply Wall St's proprietary "Fair Ratio" for Amcor is 25.9x. This Fair Ratio is designed to reflect a more tailored view of value, as it considers the company’s specific growth prospects, profit margins, market cap, risk profile, and industry differences. Rather than just looking at peers or industry averages, the Fair Ratio aims to provide a more nuanced and investor-relevant benchmark.
Comparing Amcor’s current PE ratio of 35.6x to its Fair Ratio of 25.9x, the stock appears to be trading above what would be considered fair on this basis, which suggests limited value at current levels.
Result: OVERVALUED
PE ratios tell one story, but what if the real opportunity lies elsewhere? Discover 1410 companies where insiders are betting big on explosive growth.
Upgrade Your Decision Making: Choose your Amcor Narrative
Earlier we mentioned there is an even better way to understand valuation, so let’s introduce you to Narratives, a smarter and more dynamic approach to making investment decisions on Simply Wall St's platform.
A Narrative is your unique story of what you believe about Amcor's future, connecting your perspective on the company's business direction with specific forecasts for revenue, profit, and margins. Instead of relying solely on numbers and ratios, Narratives allow you to support your viewpoint with assumptions and data, linking the story you see unfolding to an estimated fair value and comparison with the current share price.
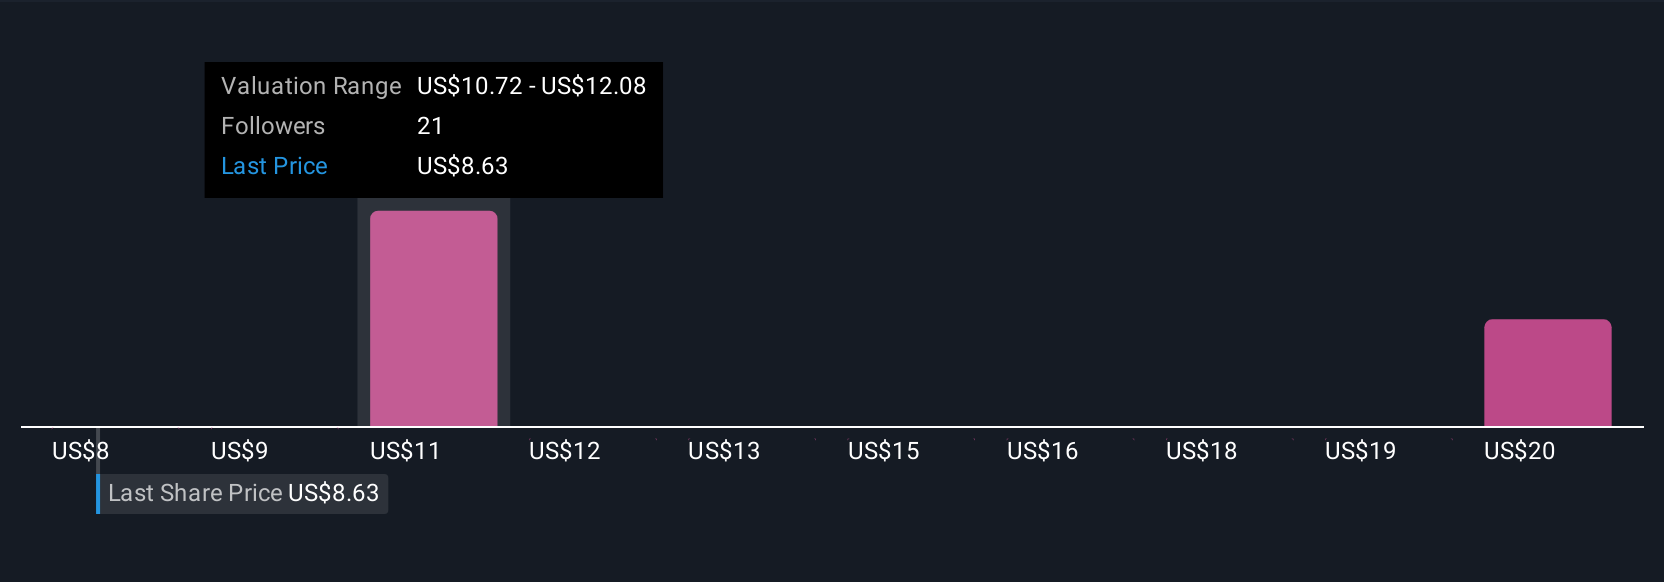
Millions of investors are already exploring Narratives in the Simply Wall St Community page because the tool is easy to use, continually updated as news and earnings arrive, and helps you decide when to buy or sell by instantly showing if the company's fair value is above or below its price. For example, analysts who see upside in cost synergies and global expansion forecast a bullish fair value for Amcor, while those worried about weak demand and financial leverage see more downside risk. Both perspectives begin with their own Narrative.
Try creating or exploring your own Amcor Narrative to make more confident, context-driven investment choices that are fully aligned with the way you see the company's story evolving.
Do you think there's more to the story for Amcor? Head over to our Community to see what others are saying!
This article by Simply Wall St is general in nature. We provide commentary based on historical data and analyst forecasts only using an unbiased methodology and our articles are not intended to be financial advice. It does not constitute a recommendation to buy or sell any stock, and does not take account of your objectives, or your financial situation. We aim to bring you long-term focused analysis driven by fundamental data. Note that our analysis may not factor in the latest price-sensitive company announcements or qualitative material. Simply Wall St has no position in any stocks mentioned.
New: Manage All Your Stock Portfolios in One Place
We've created the ultimate portfolio companion for stock investors, and it's free.
• Connect an unlimited number of Portfolios and see your total in one currency
• Be alerted to new Warning Signs or Risks via email or mobile
• Track the Fair Value of your stocks
Have feedback on this article? Concerned about the content? Get in touch with us directly. Alternatively, email editorial-team@simplywallst.com
About NYSE:AMCR
Amcor
Engages in the production and sale of packaging products in Europe, North America, Latin America, and the Asia Pacific.
Moderate risk with moderate growth potential.
Similar Companies
Market Insights

Advertisement
Community Narratives
The company that turned a verb into a global necessity and basically runs the modern internet, digital ads, smartphones, maps, and AI.
Fair Value US$300.00|7.5% undervalued
OS
Community Contributor
Flowers Foods Pays A Fair Price For Health
Fair Value US$16.12|25.4% undervalued
NV
Community Contributor
TMX Group will thrive with 33.3% profit margin and enduring market moat
Fair Value CA$49.90|3.6% overvalued
LI
Community Contributor
The "Molecular Pencil": Why Beam's Technology is Built to Win
Fair Value US$65.01|65.0% undervalued
DA
Community Contributor