- United States
- /
- Paper and Forestry Products
- /
- NasdaqGS:MERC
Mercer International Inc.'s (NASDAQ:MERC) Shares Leap 31% Yet They're Still Not Telling The Full Story
Mercer International Inc. (NASDAQ:MERC) shareholders would be excited to see that the share price has had a great month, posting a 31% gain and recovering from prior weakness. The bad news is that even after the stocks recovery in the last 30 days, shareholders are still underwater by about 6.9% over the last year.
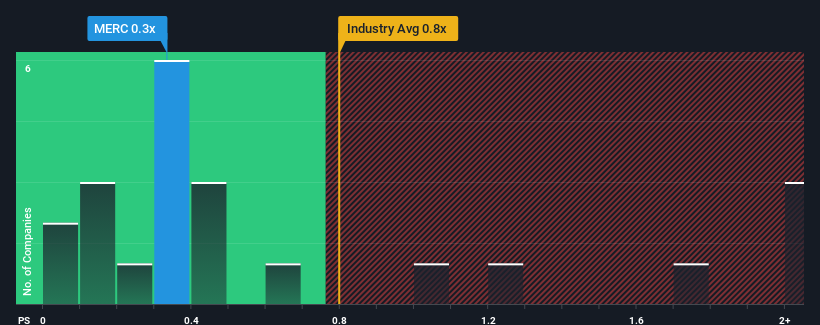
Even after such a large jump in price, it's still not a stretch to say that Mercer International's price-to-sales (or "P/S") ratio of 0.3x right now seems quite "middle-of-the-road" compared to the Forestry industry in the United States, seeing as it matches the P/S ratio of the wider industry. However, investors might be overlooking a clear opportunity or potential setback if there is no rational basis for the P/S.
Check out our latest analysis for Mercer International

How Mercer International Has Been Performing
Mercer International has been doing a reasonable job lately as its revenue hasn't declined as much as most other companies. One possibility is that the P/S ratio is moderate because investors think this relatively better revenue performance might be about to evaporate. So while you could say the stock is cheap, investors will be looking for improvement before they see it as good value. But at the very least, you'd be hoping the company doesn't fall back into the pack if your plan is to pick up some stock while it's not in favour.
If you'd like to see what analysts are forecasting going forward, you should check out our free report on Mercer International.Is There Some Revenue Growth Forecasted For Mercer International?
In order to justify its P/S ratio, Mercer International would need to produce growth that's similar to the industry.
Retrospectively, the last year delivered a frustrating 13% decrease to the company's top line. Still, the latest three year period has seen an excellent 40% overall rise in revenue, in spite of its unsatisfying short-term performance. So we can start by confirming that the company has generally done a very good job of growing revenue over that time, even though it had some hiccups along the way.
Shifting to the future, estimates from the three analysts covering the company suggest revenue should grow by 5.7% over the next year. Meanwhile, the rest of the industry is forecast to only expand by 2.4%, which is noticeably less attractive.
With this information, we find it interesting that Mercer International is trading at a fairly similar P/S compared to the industry. Apparently some shareholders are skeptical of the forecasts and have been accepting lower selling prices.
The Key Takeaway
Mercer International's stock has a lot of momentum behind it lately, which has brought its P/S level with the rest of the industry. It's argued the price-to-sales ratio is an inferior measure of value within certain industries, but it can be a powerful business sentiment indicator.
Despite enticing revenue growth figures that outpace the industry, Mercer International's P/S isn't quite what we'd expect. When we see a strong revenue outlook, with growth outpacing the industry, we can only assume potential uncertainty around these figures are what might be placing slight pressure on the P/S ratio. This uncertainty seems to be reflected in the share price which, while stable, could be higher given the revenue forecasts.
It is also worth noting that we have found 3 warning signs for Mercer International that you need to take into consideration.
Of course, profitable companies with a history of great earnings growth are generally safer bets. So you may wish to see this free collection of other companies that have reasonable P/E ratios and have grown earnings strongly.
New: Manage All Your Stock Portfolios in One Place
We've created the ultimate portfolio companion for stock investors, and it's free.
• Connect an unlimited number of Portfolios and see your total in one currency
• Be alerted to new Warning Signs or Risks via email or mobile
• Track the Fair Value of your stocks
Have feedback on this article? Concerned about the content? Get in touch with us directly. Alternatively, email editorial-team (at) simplywallst.com.
This article by Simply Wall St is general in nature. We provide commentary based on historical data and analyst forecasts only using an unbiased methodology and our articles are not intended to be financial advice. It does not constitute a recommendation to buy or sell any stock, and does not take account of your objectives, or your financial situation. We aim to bring you long-term focused analysis driven by fundamental data. Note that our analysis may not factor in the latest price-sensitive company announcements or qualitative material. Simply Wall St has no position in any stocks mentioned.
About NasdaqGS:MERC
Mercer International
Manufactures and sells northern bleached softwood kraft (NBSK) and northern bleached hardwood kraft (NBHK) pulp in the United States, Germany, China, and internationally.
Undervalued with very low risk.
Similar Companies
Market Insights
Community Narratives


Recently Updated Narratives


No miracle in sight


Q3 Outlook modestly optimistic


Alphabet: The Under-appreciated Compounder Hiding in Plain Sight
Popular Narratives


The company that turned a verb into a global necessity and basically runs the modern internet, digital ads, smartphones, maps, and AI.


MicroVision will explode future revenue by 380.37% with a vision towards success


