Advertisement
- United States
- /
- Insurance
- /
- NasdaqGS:SAFT
Safety Insurance Group (SAFT) Earnings Growth Counters Long-Term Declines, Reinforcing Dividend Stability Narrative

Simply Wall St
Reviewed by Simply Wall St
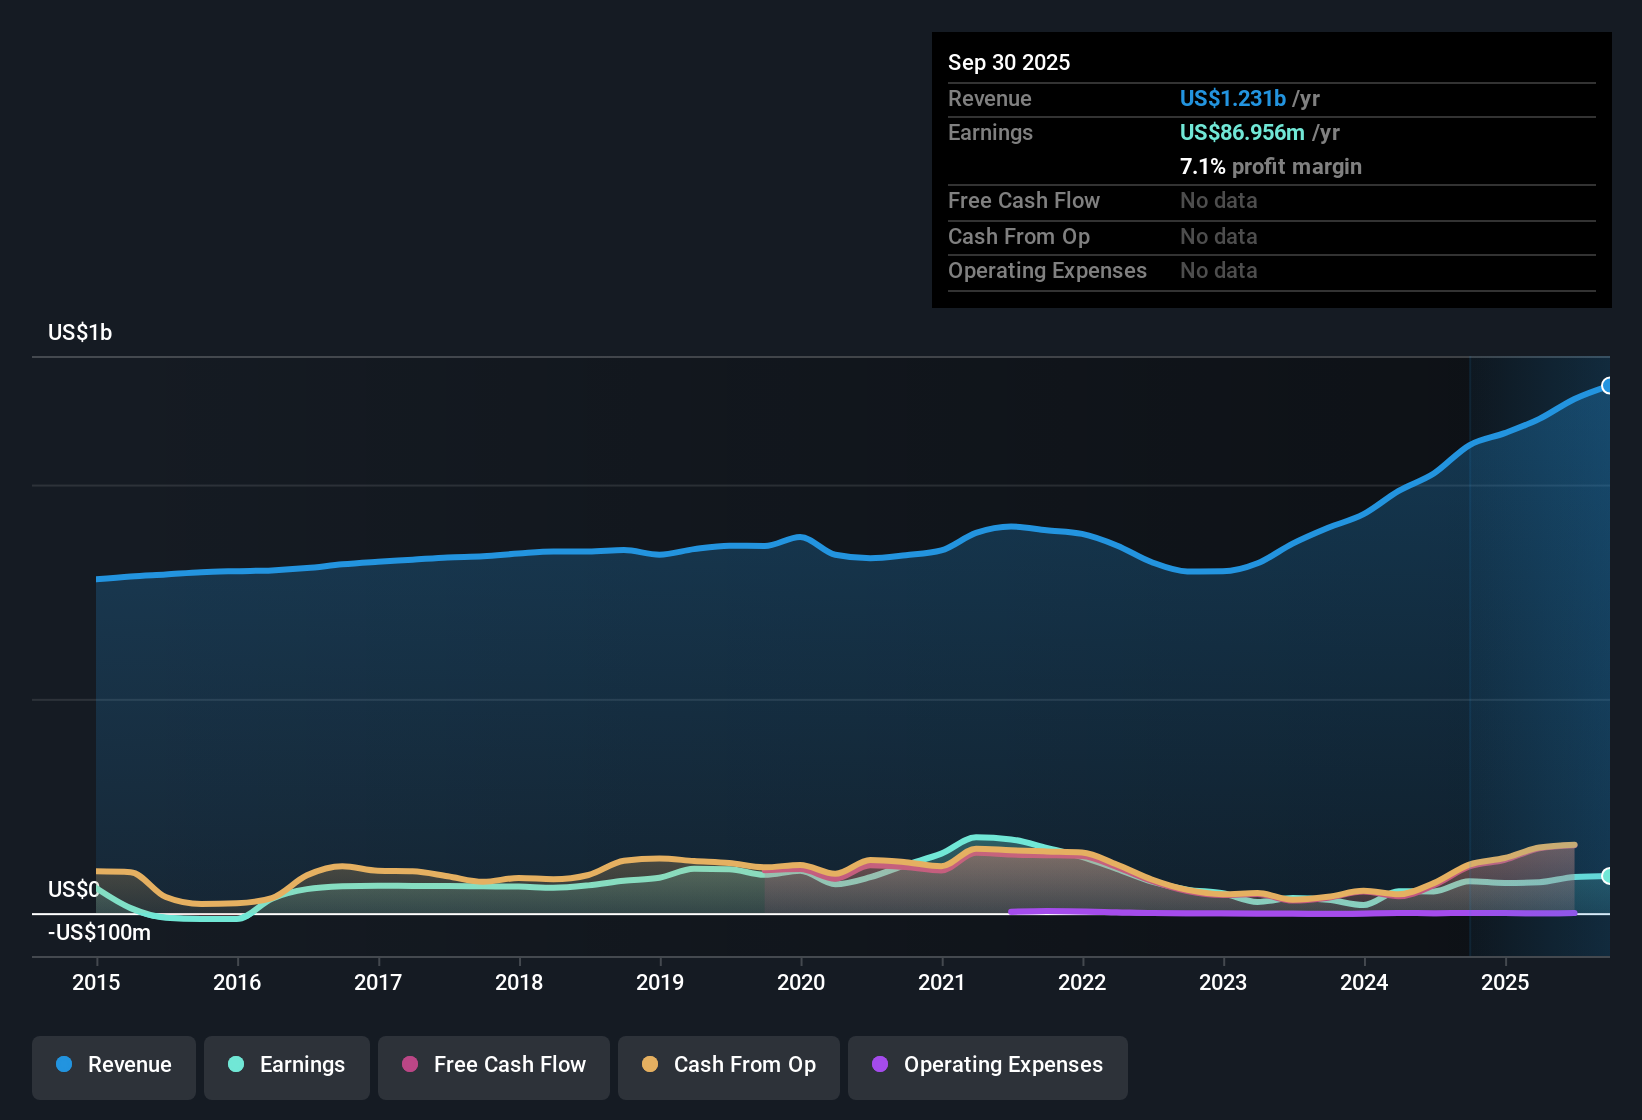
Safety Insurance Group (SAFT) posted a net profit margin of 7.1%, edging ahead of last year’s 6.8%, with EPS showing 16.7% growth for the year. This upbeat result comes despite a longer-term backdrop where average annual earnings have dropped 22.2% over five years. For investors, high-quality earnings, positive profitability trends, and an attractive dividend balance out concerns around continued long-term earnings declines and shares currently trading at $70.37, above fair value estimates.
See our full analysis for Safety Insurance Group.Next, we will see how these headline results compare with the main market narratives surrounding Safety Insurance Group. Some themes could be confirmed, while others may be ripe for debate.
Curious how numbers become stories that shape markets? Explore Community Narratives
Dividend Stands Out for Stability Seekers
- Safety Insurance Group is recognized for maintaining an attractive dividend, appealing to investors emphasizing steady income, especially as the company’s long-term average earnings have declined by 22.2% annually over five years.
- One key theme is the reliability of its payout, which aligns with those seeking defensive portfolio positions. Notably, the “defensive dividend play” faces an underlying tension:
- While stable earnings and consistent dividends make it popular among income-focused investors, this reputation is being earned even as long-term profit trends show annual declines.
- Such stability heavily supports the case for treating Safety Insurance Group as a safe haven. Its resilience and payout track record matter more to some investors than recent growth rates.
P/E Ratio Signals a Mixed Valuation Message
- The stock’s Price-To-Earnings ratio sits at 12.1x, below the US insurance industry average of 13.1x but higher than the peer group’s 9.2x, highlighting a unique middle-ground valuation.
- The prevailing analysis ties this discount to industry average with questions about growth expectations:
- Compared to other insurers, Safety Insurance Group appears slightly more favorably valued relative to the broader sector, which rewards the current profitability trend rather than strong future growth.
- However, the higher multiple versus its closest peers leaves open the argument that absent new growth drivers, the stock could face peer-relative pressure if investor preference shifts toward cheaper, fast-growing rivals.
Shares Trade at a Premium to DCF Fair Value
- With shares at $70.37, Safety Insurance Group trades well above its DCF fair value estimate of $48.03, underscoring a meaningful premium relative to modeled fundamentals.
- Market watchers point to this premium as a material valuation gap to monitor:
- The practice of pricing in stability and a robust dividend may be driving this premium, but ongoing lack of expected growth in revenue and earnings raises the question of whether the stock can justify trading far above DCF fair value.
- In absence of a new earnings catalyst, there is potential for a near-term valuation reset if investor patience with premium pricing runs thin.
To see how the story unfolds and how different market perspectives weigh in, read the full consensus narrative for Safety Insurance Group. 📊 Read the full Safety Insurance Group Consensus Narrative.
Next Steps
Don't just look at this quarter; the real story is in the long-term trend. We've done an in-depth analysis on Safety Insurance Group's growth and its valuation to see if today's price is a bargain. Add the company to your watchlist or portfolio now so you don't miss the next big move.
See What Else Is Out There
Despite a solid dividend and recent margin gains, Safety Insurance Group is weighed down by long-term earnings declines and shares trading well above fair value.
If you want to sidestep the risk of overpaying for limited growth, discover better value opportunities with these 844 undervalued stocks based on cash flows.
This article by Simply Wall St is general in nature. We provide commentary based on historical data and analyst forecasts only using an unbiased methodology and our articles are not intended to be financial advice. It does not constitute a recommendation to buy or sell any stock, and does not take account of your objectives, or your financial situation. We aim to bring you long-term focused analysis driven by fundamental data. Note that our analysis may not factor in the latest price-sensitive company announcements or qualitative material. Simply Wall St has no position in any stocks mentioned.
New: Manage All Your Stock Portfolios in One Place
We've created the ultimate portfolio companion for stock investors, and it's free.
• Connect an unlimited number of Portfolios and see your total in one currency
• Be alerted to new Warning Signs or Risks via email or mobile
• Track the Fair Value of your stocks
Have feedback on this article? Concerned about the content? Get in touch with us directly. Alternatively, email editorial-team@simplywallst.com
About NasdaqGS:SAFT
Safety Insurance Group
Provides private passenger and commercial automobile, and homeowner insurance in the United States.
6 star dividend payer with excellent balance sheet.
Similar Companies
Market Insights

Advertisement
Community Narratives
The company that turned a verb into a global necessity and basically runs the modern internet, digital ads, smartphones, maps, and AI.
Fair Value US$300.00|7.5% undervalued
OS
Community Contributor
Flowers Foods Pays A Fair Price For Health
Fair Value US$16.12|25.4% undervalued
NV
Community Contributor
TMX Group will thrive with 33.3% profit margin and enduring market moat
Fair Value CA$49.90|3.6% overvalued
LI
Community Contributor
The "Molecular Pencil": Why Beam's Technology is Built to Win
Fair Value US$65.01|65.0% undervalued
DA
Community Contributor