Stock Analysis
- United States
- /
- Insurance
- /
- NasdaqGS:NWLI
How Does National Western Life Group's (NASDAQ:NWLI) P/E Compare To Its Industry, After The Share Price Drop?


Unfortunately for some shareholders, the National Western Life Group (NASDAQ:NWLI) share price has dived 34% in the last thirty days. That drop has capped off a tough year for shareholders, with the share price down 34% in that time.
All else being equal, a share price drop should make a stock more attractive to potential investors. In the long term, share prices tend to follow earnings per share, but in the short term prices bounce around in response to short term factors (which are not always obvious). The implication here is that long term investors have an opportunity when expectations of a company are too low. Perhaps the simplest way to get a read on investors' expectations of a business is to look at its Price to Earnings Ratio (PE Ratio). A high P/E implies that investors have high expectations of what a company can achieve compared to a company with a low P/E ratio.
Check out our latest analysis for National Western Life Group
Does National Western Life Group Have A Relatively High Or Low P/E For Its Industry?
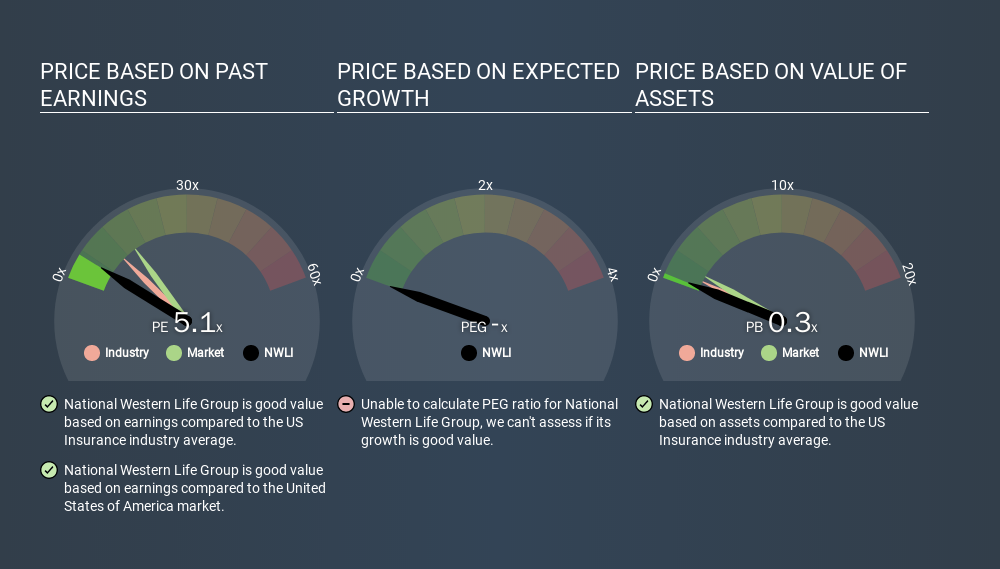
National Western Life Group's P/E of 5.06 indicates relatively low sentiment towards the stock. If you look at the image below, you can see National Western Life Group has a lower P/E than the average (9.0) in the insurance industry classification.
Its relatively low P/E ratio indicates that National Western Life Group shareholders think it will struggle to do as well as other companies in its industry classification. Since the market seems unimpressed with National Western Life Group, it's quite possible it could surprise on the upside. If you consider the stock interesting, further research is recommended. For example, I often monitor director buying and selling.
How Growth Rates Impact P/E Ratios
P/E ratios primarily reflect market expectations around earnings growth rates. Earnings growth means that in the future the 'E' will be higher. That means unless the share price increases, the P/E will reduce in a few years. And as that P/E ratio drops, the company will look cheap, unless its share price increases.
National Western Life Group increased earnings per share by an impressive 13% over the last twelve months. And earnings per share have improved by 4.5% annually, over the last five years. So one might expect an above average P/E ratio.
Remember: P/E Ratios Don't Consider The Balance Sheet
Don't forget that the P/E ratio considers market capitalization. That means it doesn't take debt or cash into account. Hypothetically, a company could reduce its future P/E ratio by spending its cash (or taking on debt) to achieve higher earnings.
While growth expenditure doesn't always pay off, the point is that it is a good option to have; but one that the P/E ratio ignores.
So What Does National Western Life Group's Balance Sheet Tell Us?
With net cash of US$254m, National Western Life Group has a very strong balance sheet, which may be important for its business. Having said that, at 38% of its market capitalization the cash hoard would contribute towards a higher P/E ratio.
The Bottom Line On National Western Life Group's P/E Ratio
National Western Life Group trades on a P/E ratio of 5.1, which is below the US market average of 13.3. Not only should the net cash position reduce risk, but the recent growth has been impressive. One might conclude that the market is a bit pessimistic, given the low P/E ratio. Given National Western Life Group's P/E ratio has declined from 7.6 to 5.1 in the last month, we know for sure that the market is more worried about the business today, than it was back then. For those who prefer invest in growth, this stock apparently offers limited promise, but the deep value investors may find the pessimism around this stock enticing.
When the market is wrong about a stock, it gives savvy investors an opportunity. If the reality for a company is not as bad as the P/E ratio indicates, then the share price should increase as the market realizes this. We don't have analyst forecasts, but you could get a better understanding of its growth by checking out this more detailed historical graph of earnings, revenue and cash flow.
Of course you might be able to find a better stock than National Western Life Group. So you may wish to see this free collection of other companies that have grown earnings strongly.
If you spot an error that warrants correction, please contact the editor at editorial-team@simplywallst.com. This article by Simply Wall St is general in nature. It does not constitute a recommendation to buy or sell any stock, and does not take account of your objectives, or your financial situation. Simply Wall St has no position in the stocks mentioned.
We aim to bring you long-term focused research analysis driven by fundamental data. Note that our analysis may not factor in the latest price-sensitive company announcements or qualitative material. Thank you for reading.
About NasdaqGS:NWLI
National Western Life Group
Through its subsidiary, National Western Life Insurance Company, operates as a stock life insurance company in the United States, Brazil, Taiwan, Peru, Venezuela, Colombia, and internationally.
Excellent balance sheet and good value.
