Stock Analysis
- United States
- /
- Household Products
- /
- NYSE:ODC
Oil-Dri Corporation of America's (NYSE:ODC) Returns On Capital Not Reflecting Well On The Business


When it comes to investing, there are some useful financial metrics that can warn us when a business is potentially in trouble. A business that's potentially in decline often shows two trends, a return on capital employed (ROCE) that's declining, and a base of capital employed that's also declining. This indicates to us that the business is not only shrinking the size of its net assets, but its returns are falling as well. In light of that, from a first glance at Oil-Dri Corporation of America (NYSE:ODC), we've spotted some signs that it could be struggling, so let's investigate.
What is Return On Capital Employed (ROCE)?
If you haven't worked with ROCE before, it measures the 'return' (pre-tax profit) a company generates from capital employed in its business. Analysts use this formula to calculate it for Oil-Dri Corporation of America:
Return on Capital Employed = Earnings Before Interest and Tax (EBIT) ÷ (Total Assets - Current Liabilities)
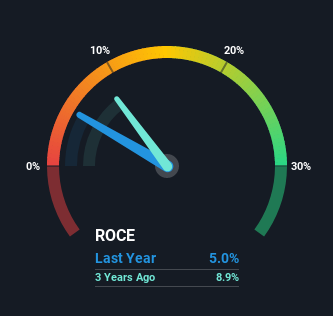
0.05 = US$9.8m ÷ (US$228m - US$35m) (Based on the trailing twelve months to January 2021).
Therefore, Oil-Dri Corporation of America has an ROCE of 5.0%. Ultimately, that's a low return and it under-performs the Household Products industry average of 18%.
See our latest analysis for Oil-Dri Corporation of America
While the past is not representative of the future, it can be helpful to know how a company has performed historically, which is why we have this chart above. If you'd like to look at how Oil-Dri Corporation of America has performed in the past in other metrics, you can view this free graph of past earnings, revenue and cash flow.
What Does the ROCE Trend For Oil-Dri Corporation of America Tell Us?
There is reason to be cautious about Oil-Dri Corporation of America, given the returns are trending downwards. Unfortunately the returns on capital have diminished from the 13% that they were earning five years ago. On top of that, it's worth noting that the amount of capital employed within the business has remained relatively steady. This combination can be indicative of a mature business that still has areas to deploy capital, but the returns received aren't as high due potentially to new competition or smaller margins. So because these trends aren't typically conducive to creating a multi-bagger, we wouldn't hold our breath on Oil-Dri Corporation of America becoming one if things continue as they have.
In Conclusion...
In the end, the trend of lower returns on the same amount of capital isn't typically an indication that we're looking at a growth stock. Investors must expect better things on the horizon though because the stock has risen 25% in the last five years. Regardless, we don't like the trends as they are and if they persist, we think you might find better investments elsewhere.
On a final note, we've found 1 warning sign for Oil-Dri Corporation of America that we think you should be aware of.
While Oil-Dri Corporation of America may not currently earn the highest returns, we've compiled a list of companies that currently earn more than 25% return on equity. Check out this free list here.
If you decide to trade Oil-Dri Corporation of America, use the lowest-cost* platform that is rated #1 Overall by Barron’s, Interactive Brokers. Trade stocks, options, futures, forex, bonds and funds on 135 markets, all from a single integrated account. Promoted
Valuation is complex, but we're helping make it simple.
Find out whether Oil-Dri Corporation of America is potentially over or undervalued by checking out our comprehensive analysis, which includes fair value estimates, risks and warnings, dividends, insider transactions and financial health.
View the Free AnalysisThis article by Simply Wall St is general in nature. It does not constitute a recommendation to buy or sell any stock, and does not take account of your objectives, or your financial situation. We aim to bring you long-term focused analysis driven by fundamental data. Note that our analysis may not factor in the latest price-sensitive company announcements or qualitative material. Simply Wall St has no position in any stocks mentioned.
*Interactive Brokers Rated Lowest Cost Broker by StockBrokers.com Annual Online Review 2020
Have feedback on this article? Concerned about the content? Get in touch with us directly. Alternatively, email editorial-team (at) simplywallst.com.
About NYSE:ODC
Oil-Dri Corporation of America
Develops, manufactures, and markets sorbent products in the United States and internationally.
Outstanding track record with excellent balance sheet and pays a dividend.
