Stock Analysis
- United States
- /
- Healthcare Services
- /
- NYSE:USPH
Investors five-year losses continue as U.S. Physical Therapy (NYSE:USPH) dips a further 4.3% this week, earnings continue to decline


In order to justify the effort of selecting individual stocks, it's worth striving to beat the returns from a market index fund. But in any portfolio, there will be mixed results between individual stocks. So we wouldn't blame long term U.S. Physical Therapy, Inc. (NYSE:USPH) shareholders for doubting their decision to hold, with the stock down 24% over a half decade. Furthermore, it's down 16% in about a quarter. That's not much fun for holders.
Since U.S. Physical Therapy has shed US$63m from its value in the past 7 days, let's see if the longer term decline has been driven by the business' economics.
See our latest analysis for U.S. Physical Therapy
To quote Buffett, 'Ships will sail around the world but the Flat Earth Society will flourish. There will continue to be wide discrepancies between price and value in the marketplace...' One flawed but reasonable way to assess how sentiment around a company has changed is to compare the earnings per share (EPS) with the share price.
Looking back five years, both U.S. Physical Therapy's share price and EPS declined; the latter at a rate of 4.1% per year. Readers should note that the share price has fallen faster than the EPS, at a rate of 5% per year, over the period. This implies that the market was previously too optimistic about the stock. Of course, with a P/E ratio of 78.80, the market remains optimistic.
The company's earnings per share (over time) is depicted in the image below (click to see the exact numbers).
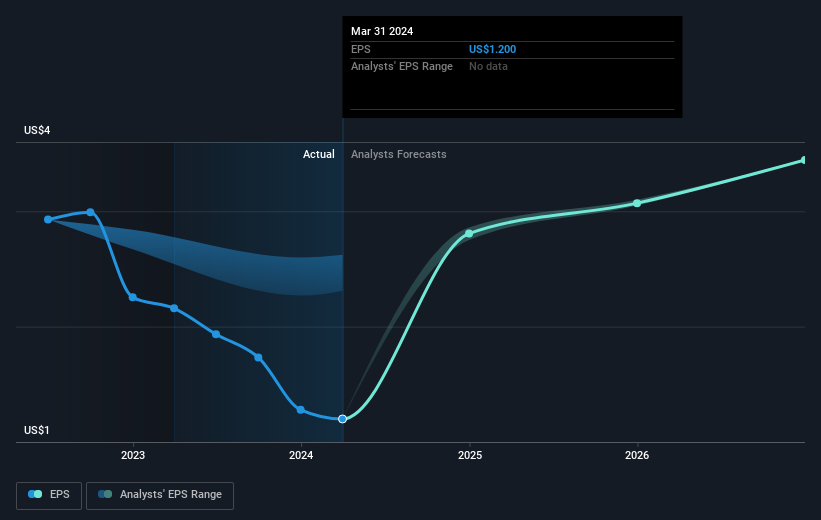
We're pleased to report that the CEO is remunerated more modestly than most CEOs at similarly capitalized companies. But while CEO remuneration is always worth checking, the really important question is whether the company can grow earnings going forward. Before buying or selling a stock, we always recommend a close examination of historic growth trends, available here..
What About Dividends?
It is important to consider the total shareholder return, as well as the share price return, for any given stock. The TSR incorporates the value of any spin-offs or discounted capital raisings, along with any dividends, based on the assumption that the dividends are reinvested. It's fair to say that the TSR gives a more complete picture for stocks that pay a dividend. In the case of U.S. Physical Therapy, it has a TSR of -19% for the last 5 years. That exceeds its share price return that we previously mentioned. And there's no prize for guessing that the dividend payments largely explain the divergence!
A Different Perspective
While the broader market gained around 26% in the last year, U.S. Physical Therapy shareholders lost 18% (even including dividends). Even the share prices of good stocks drop sometimes, but we want to see improvements in the fundamental metrics of a business, before getting too interested. Regrettably, last year's performance caps off a bad run, with the shareholders facing a total loss of 4% per year over five years. We realise that Baron Rothschild has said investors should "buy when there is blood on the streets", but we caution that investors should first be sure they are buying a high quality business. It's always interesting to track share price performance over the longer term. But to understand U.S. Physical Therapy better, we need to consider many other factors. Consider risks, for instance. Every company has them, and we've spotted 5 warning signs for U.S. Physical Therapy you should know about.
Of course U.S. Physical Therapy may not be the best stock to buy. So you may wish to see this free collection of growth stocks.
Please note, the market returns quoted in this article reflect the market weighted average returns of stocks that currently trade on American exchanges.
Valuation is complex, but we're helping make it simple.
Find out whether U.S. Physical Therapy is potentially over or undervalued by checking out our comprehensive analysis, which includes fair value estimates, risks and warnings, dividends, insider transactions and financial health.
View the Free AnalysisHave feedback on this article? Concerned about the content? Get in touch with us directly. Alternatively, email editorial-team (at) simplywallst.com.
This article by Simply Wall St is general in nature. We provide commentary based on historical data and analyst forecasts only using an unbiased methodology and our articles are not intended to be financial advice. It does not constitute a recommendation to buy or sell any stock, and does not take account of your objectives, or your financial situation. We aim to bring you long-term focused analysis driven by fundamental data. Note that our analysis may not factor in the latest price-sensitive company announcements or qualitative material. Simply Wall St has no position in any stocks mentioned.
Valuation is complex, but we're helping make it simple.
Find out whether U.S. Physical Therapy is potentially over or undervalued by checking out our comprehensive analysis, which includes fair value estimates, risks and warnings, dividends, insider transactions and financial health.
View the Free AnalysisHave feedback on this article? Concerned about the content? Get in touch with us directly. Alternatively, email editorial-team@simplywallst.com
About NYSE:USPH
Adequate balance sheet and fair value.
