Advertisement
- United States
- /
- Healthcare Services
- /
- NYSE:UHS
Has Universal Health Services Run Ahead of Itself After 25% Rally and Network Expansion?

Simply Wall St
Reviewed by Bailey Pemberton
- Ever wondered if Universal Health Services could be quietly trading at a bargain, or if the price is already running ahead of itself? Let’s dig into what the numbers and market signals are really telling us.
- The stock has had a strong year so far, climbing 24.8% year-to-date with recent momentum pushing it up another 8.2% over the last month alone.
- Shares have been in focus lately after the company expanded its behavioral health network and landed new managed care agreements. These developments have caught investors’ eyes and may help drive further growth. Market watchers are also paying attention to shifting policy discussions in healthcare that could affect the sector.
- On our latest check, Universal Health Services scores 5 out of 6 on our valuation score. This means it stands out as undervalued in nearly every key metric we track. Next, we’ll break down exactly what’s behind those numbers, plus share an even smarter way to make sense of valuation at the end of this article.
Approach 1: Universal Health Services Discounted Cash Flow (DCF) Analysis
The Discounted Cash Flow (DCF) model estimates a company’s intrinsic value by projecting its future cash flows and then discounting them back to what they are worth today. This approach helps investors gauge if a stock’s current price reflects its true value based on future performance.
Universal Health Services has a current Free Cash Flow (FCF) of $1.00 billion. According to existing analyst projections and further extrapolations, the company’s cash flows are expected to grow steadily, reaching a projected $2.02 billion by 2035. Analysts provide data for the next five years; beyond that, estimates are derived by Simply Wall St based on historical trends and reasonable growth assumptions.
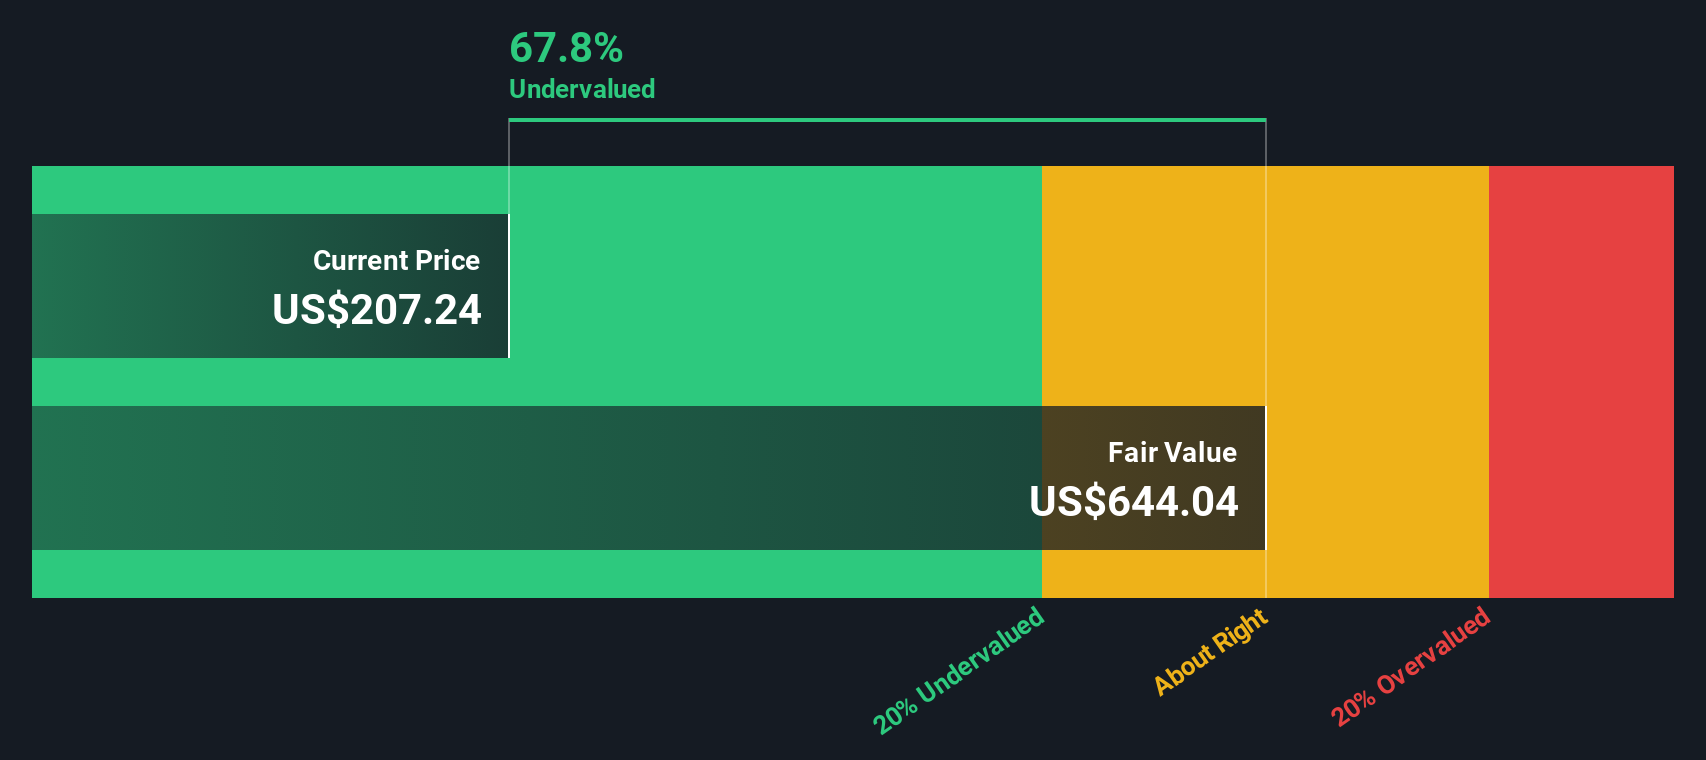
Using these cash flow forecasts, the DCF model calculates an intrinsic value of $644 per share. This is 65.2% higher than the current market price, which suggests that the stock may currently be undervalued.
Result: UNDERVALUED
Our Discounted Cash Flow (DCF) analysis suggests Universal Health Services is undervalued by 65.2%. Track this in your watchlist or portfolio, or discover 844 more undervalued stocks based on cash flows.
Approach 2: Universal Health Services Price vs Earnings
For businesses with consistent profits like Universal Health Services, the Price-to-Earnings (PE) ratio is a proven way to gauge value. The PE ratio tells investors how much they are paying for each dollar of earnings. A lower number might signal a bargain, while a higher one could suggest the stock is fully priced or even expensive.
What counts as a “fair” PE ratio depends on a company’s expected growth and risk. Fast-growing, stable firms can justify higher PEs, while slower growers or riskier companies generally deserve lower multiples.
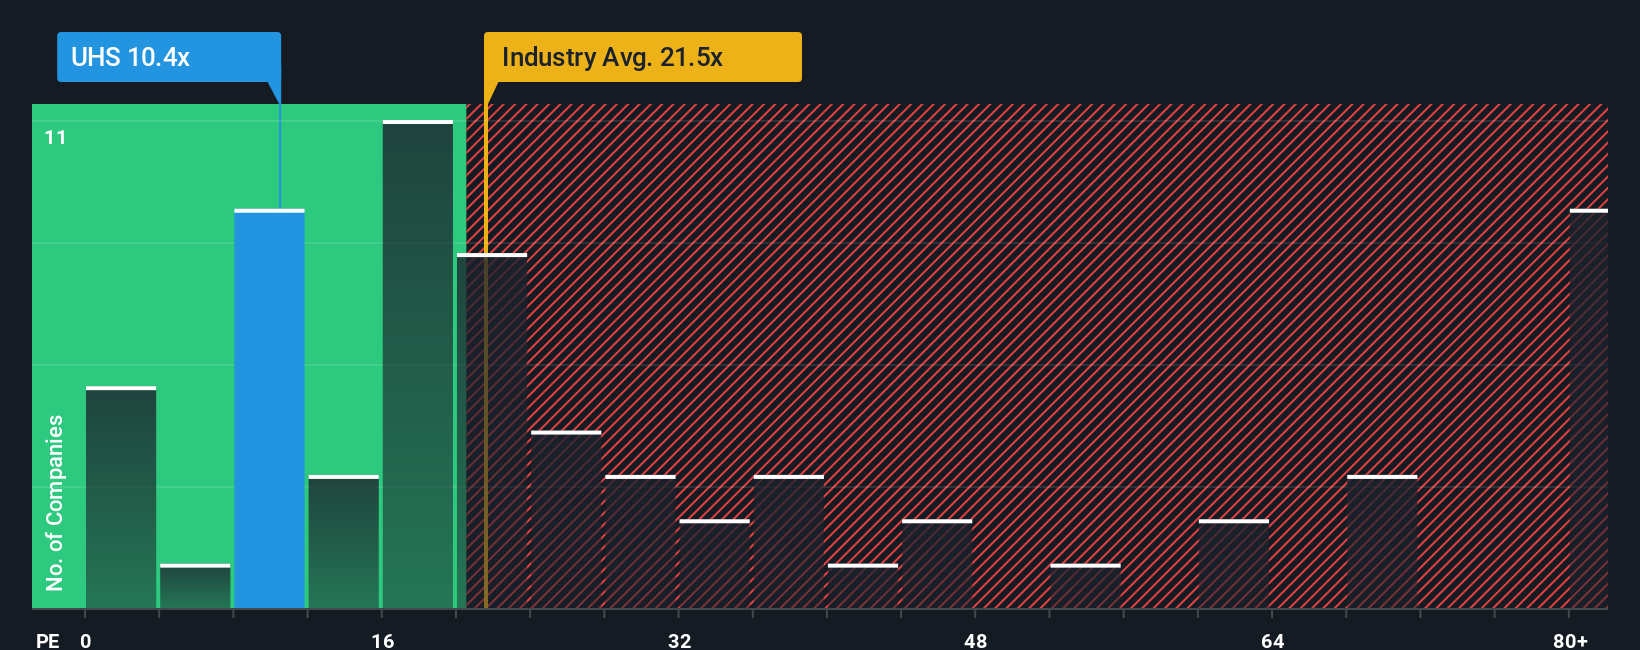
Universal Health Services currently trades at a PE of 10.37x. By comparison, the average PE in the Healthcare industry is 20.66x, and direct peers average 21.07x. On the surface, this looks like a deep discount.
But instead of just measuring against industry averages, Simply Wall St’s proprietary Fair Ratio provides a more tailored benchmark. The Fair Ratio, which is 21.95x for Universal Health Services, incorporates factors like its earnings growth, profit margins, sector, market cap, and unique risk profile. This approach gives a much more complete picture of what the stock should be worth, rather than just comparing it to a broad group.
Since the company’s actual PE (10.37x) is well below its Fair Ratio (21.95x), Universal Health Services appears significantly undervalued on this measure.
Result: UNDERVALUED
PE ratios tell one story, but what if the real opportunity lies elsewhere? Discover 1409 companies where insiders are betting big on explosive growth.
Upgrade Your Decision Making: Choose your Universal Health Services Narrative
Earlier we mentioned that there is an even better way to understand valuation, so let’s introduce you to Narratives. A Narrative is your personal story about a company, connecting your view of its prospects, like future revenues, earnings, and margins, with a clear, numbers-based fair value.
With Narratives, you are not just relying on market averages or industry formulas, but shaping your own forecast and seeing exactly how it impacts what you believe the company is worth. It's simple and accessible: on Simply Wall St’s Community page, investors can create, share, and compare Narratives, transparently updating their assumptions as new news or earnings data comes in.
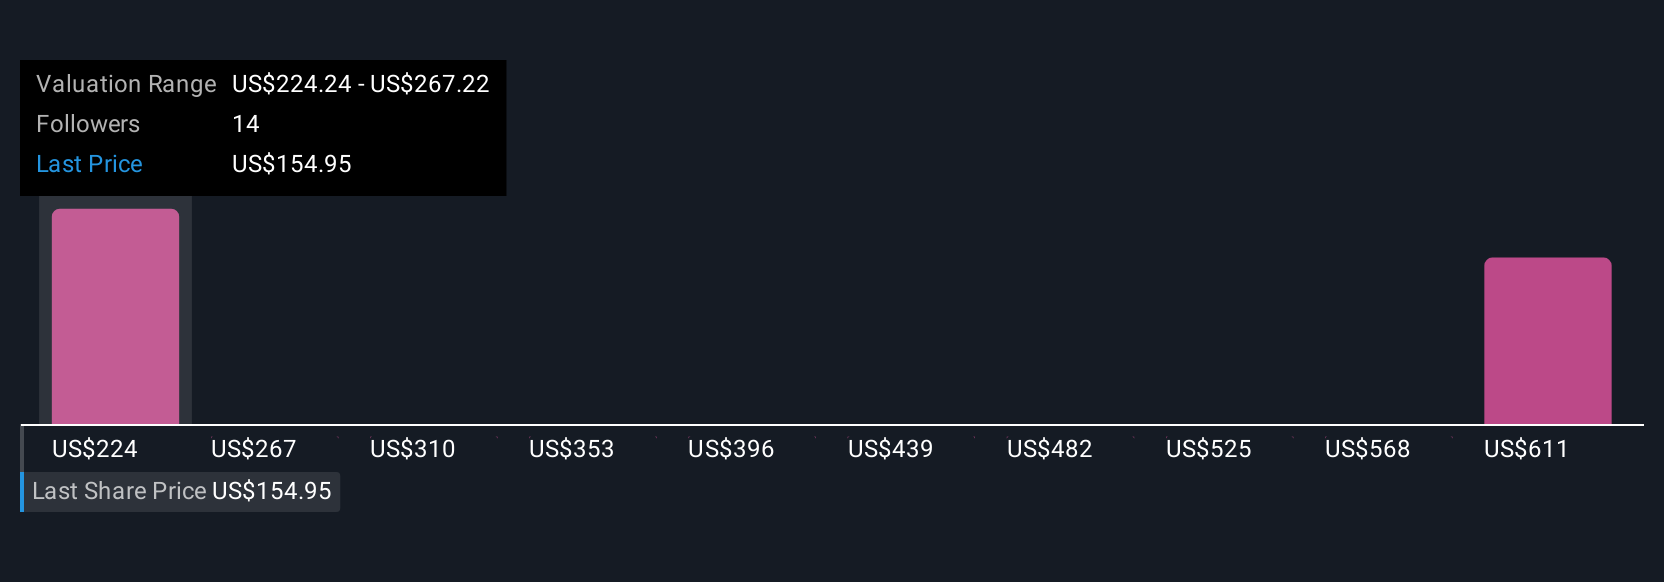
This means you can instantly see if your Narrative-based Fair Value is above or below today’s share price, helping you decide whether it is time to buy, hold, or sell. For example, some Universal Health Services investors see strong growth and assign a Fair Value as high as $280, while others, more cautious about risks, set theirs as low as $165. This highlights just how much your perspective can matter when making investment decisions.
Do you think there's more to the story for Universal Health Services? Head over to our Community to see what others are saying!
This article by Simply Wall St is general in nature. We provide commentary based on historical data and analyst forecasts only using an unbiased methodology and our articles are not intended to be financial advice. It does not constitute a recommendation to buy or sell any stock, and does not take account of your objectives, or your financial situation. We aim to bring you long-term focused analysis driven by fundamental data. Note that our analysis may not factor in the latest price-sensitive company announcements or qualitative material. Simply Wall St has no position in any stocks mentioned.
New: AI Stock Screener & Alerts
Our new AI Stock Screener scans the market every day to uncover opportunities.
• Dividend Powerhouses (3%+ Yield)
• Undervalued Small Caps with Insider Buying
• High growth Tech and AI Companies
Or build your own from over 50 metrics.
Have feedback on this article? Concerned about the content? Get in touch with us directly. Alternatively, email editorial-team@simplywallst.com
About NYSE:UHS
Universal Health Services
Through its subsidiaries, owns and operates acute care hospitals, and outpatient and behavioral health care facilities.
Undervalued with solid track record.
Similar Companies
Market Insights

Advertisement
Community Narratives
The company that turned a verb into a global necessity and basically runs the modern internet, digital ads, smartphones, maps, and AI.
Fair Value US$300.00|7.5% undervalued
OS
Community Contributor
Flowers Foods Pays A Fair Price For Health
Fair Value US$16.12|25.4% undervalued
NV
Community Contributor
TMX Group will thrive with 33.3% profit margin and enduring market moat
Fair Value CA$49.90|3.6% overvalued
LI
Community Contributor
The "Molecular Pencil": Why Beam's Technology is Built to Win
Fair Value US$65.01|65.0% undervalued
DA
Community Contributor