
Advertisement
- United States
- /
- Medical Equipment
- /
- NasdaqGS:TRIB
A Look At The Fair Value Of Trinity Biotech plc (NASDAQ:TRIB)

Key Insights
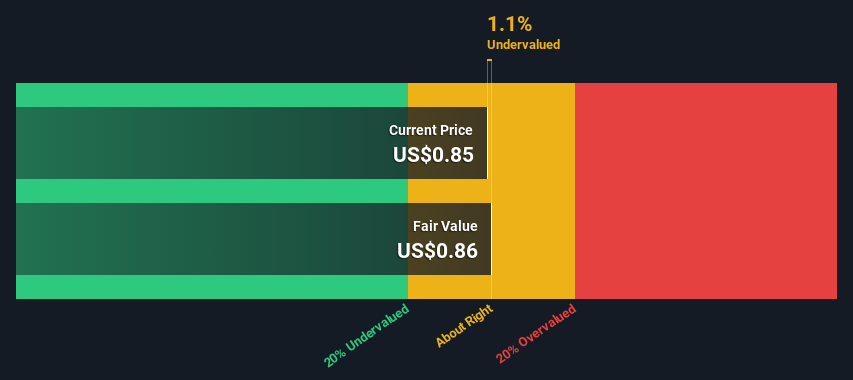
- Using the 2 Stage Free Cash Flow to Equity, Trinity Biotech fair value estimate is US$0.86
- With US$0.85 share price, Trinity Biotech appears to be trading close to its estimated fair value
- Trinity Biotech's peers are currently trading at a premium of 14% on average
Today we'll do a simple run through of a valuation method used to estimate the attractiveness of Trinity Biotech plc (NASDAQ:TRIB) as an investment opportunity by projecting its future cash flows and then discounting them to today's value. One way to achieve this is by employing the Discounted Cash Flow (DCF) model. It may sound complicated, but actually it is quite simple!
We would caution that there are many ways of valuing a company and, like the DCF, each technique has advantages and disadvantages in certain scenarios. If you still have some burning questions about this type of valuation, take a look at the Simply Wall St analysis model.
View our latest analysis for Trinity Biotech
The Method
We're using the 2-stage growth model, which simply means we take in account two stages of company's growth. In the initial period the company may have a higher growth rate and the second stage is usually assumed to have a stable growth rate. To begin with, we have to get estimates of the next ten years of cash flows. Where possible we use analyst estimates, but when these aren't available we extrapolate the previous free cash flow (FCF) from the last estimate or reported value. We assume companies with shrinking free cash flow will slow their rate of shrinkage, and that companies with growing free cash flow will see their growth rate slow, over this period. We do this to reflect that growth tends to slow more in the early years than it does in later years.
A DCF is all about the idea that a dollar in the future is less valuable than a dollar today, and so the sum of these future cash flows is then discounted to today's value:
10-year free cash flow (FCF) estimate
| 2024 | 2025 | 2026 | 2027 | 2028 | 2029 | 2030 | 2031 | 2032 | 2033 | |
| Levered FCF ($, Millions) | US$2.49m | US$3.03m | US$3.50m | US$3.91m | US$4.26m | US$4.55m | US$4.79m | US$5.01m | US$5.19m | US$5.36m |
| Growth Rate Estimate Source | Analyst x1 | Est @ 21.61% | Est @ 15.77% | Est @ 11.68% | Est @ 8.82% | Est @ 6.82% | Est @ 5.42% | Est @ 4.44% | Est @ 3.75% | Est @ 3.27% |
| Present Value ($, Millions) Discounted @ 14% | US$2.2 | US$2.3 | US$2.4 | US$2.3 | US$2.2 | US$2.1 | US$1.9 | US$1.8 | US$1.6 | US$1.5 |
("Est" = FCF growth rate estimated by Simply Wall St)
Present Value of 10-year Cash Flow (PVCF) = US$20m
The second stage is also known as Terminal Value, this is the business's cash flow after the first stage. The Gordon Growth formula is used to calculate Terminal Value at a future annual growth rate equal to the 5-year average of the 10-year government bond yield of 2.2%. We discount the terminal cash flows to today's value at a cost of equity of 14%.
Terminal Value (TV)= FCF2033 × (1 + g) ÷ (r – g) = US$5.4m× (1 + 2.2%) ÷ (14%– 2.2%) = US$46m
Present Value of Terminal Value (PVTV)= TV / (1 + r)10= US$46m÷ ( 1 + 14%)10= US$13m
The total value is the sum of cash flows for the next ten years plus the discounted terminal value, which results in the Total Equity Value, which in this case is US$33m. To get the intrinsic value per share, we divide this by the total number of shares outstanding. Compared to the current share price of US$0.8, the company appears about fair value at a 1.1% discount to where the stock price trades currently. Remember though, that this is just an approximate valuation, and like any complex formula - garbage in, garbage out.
Important Assumptions
We would point out that the most important inputs to a discounted cash flow are the discount rate and of course the actual cash flows. Part of investing is coming up with your own evaluation of a company's future performance, so try the calculation yourself and check your own assumptions. The DCF also does not consider the possible cyclicality of an industry, or a company's future capital requirements, so it does not give a full picture of a company's potential performance. Given that we are looking at Trinity Biotech as potential shareholders, the cost of equity is used as the discount rate, rather than the cost of capital (or weighted average cost of capital, WACC) which accounts for debt. In this calculation we've used 14%, which is based on a levered beta of 2.000. Beta is a measure of a stock's volatility, compared to the market as a whole. We get our beta from the industry average beta of globally comparable companies, with an imposed limit between 0.8 and 2.0, which is a reasonable range for a stable business.
SWOT Analysis for Trinity Biotech
Strength
- Debt is well covered by earnings.
Weakness
- No major weaknesses identified for TRIB.
Opportunity
- Forecast to reduce losses next year.
- Current share price is below our estimate of fair value.
Threat
- Debt is not well covered by operating cash flow.
- Has less than 3 years of cash runway based on current free cash flow.
- Total liabilities exceed total assets, which raises the risk of financial distress.
Moving On:
Valuation is only one side of the coin in terms of building your investment thesis, and it shouldn't be the only metric you look at when researching a company. The DCF model is not a perfect stock valuation tool. Preferably you'd apply different cases and assumptions and see how they would impact the company's valuation. For instance, if the terminal value growth rate is adjusted slightly, it can dramatically alter the overall result. For Trinity Biotech, we've put together three essential aspects you should explore:
- Risks: Take risks, for example - Trinity Biotech has 5 warning signs we think you should be aware of.
- Future Earnings: How does TRIB's growth rate compare to its peers and the wider market? Dig deeper into the analyst consensus number for the upcoming years by interacting with our free analyst growth expectation chart.
- Other Solid Businesses: Low debt, high returns on equity and good past performance are fundamental to a strong business. Why not explore our interactive list of stocks with solid business fundamentals to see if there are other companies you may not have considered!
PS. Simply Wall St updates its DCF calculation for every American stock every day, so if you want to find the intrinsic value of any other stock just search here.
Valuation is complex, but we're here to simplify it.
Discover if Trinity Biotech might be undervalued or overvalued with our detailed analysis, featuring fair value estimates, potential risks, dividends, insider trades, and its financial condition.
Access Free AnalysisHave feedback on this article? Concerned about the content? Get in touch with us directly. Alternatively, email editorial-team (at) simplywallst.com.
This article by Simply Wall St is general in nature. We provide commentary based on historical data and analyst forecasts only using an unbiased methodology and our articles are not intended to be financial advice. It does not constitute a recommendation to buy or sell any stock, and does not take account of your objectives, or your financial situation. We aim to bring you long-term focused analysis driven by fundamental data. Note that our analysis may not factor in the latest price-sensitive company announcements or qualitative material. Simply Wall St has no position in any stocks mentioned.
About NasdaqGS:TRIB
Trinity Biotech
Acquires, together with its subsidiaries, develops, acquires, manufactures, and markets medical diagnostic products for the clinical laboratory and point-of-care (POC) segments of the diagnostic market in the Americas, Asia, Africa, and Europe.
Medium-low and slightly overvalued.
Similar Companies
Market Insights


Advertisement
Community Narratives
A case for TSXV:USA to reach USD $5.00 - $9.00 (CAD $7.30–$12.29) by 2029.
Fair Value CA$12.29|91.1% undervalued
AG
Community Contributor
DLocal's Future Growth Fueled by 35% Revenue and Profit Margin Boosts
Fair Value US$195.39|94.2% undervalued
WY
Community Contributor
Historically Cheap, but the Margin of Safety Is Still Thin
Fair Value SEK 232.58|13.6% undervalued
MA
Community Contributor