
Advertisement
- United States
- /
- Healthtech
- /
- NasdaqCM:STRM
Revenues Working Against Streamline Health Solutions, Inc.'s (NASDAQ:STRM) Share Price Following 26% Dive
Streamline Health Solutions, Inc. (NASDAQ:STRM) shares have retraced a considerable 26% in the last month, reversing a fair amount of their solid recent performance. The recent drop completes a disastrous twelve months for shareholders, who are sitting on a 81% loss during that time.
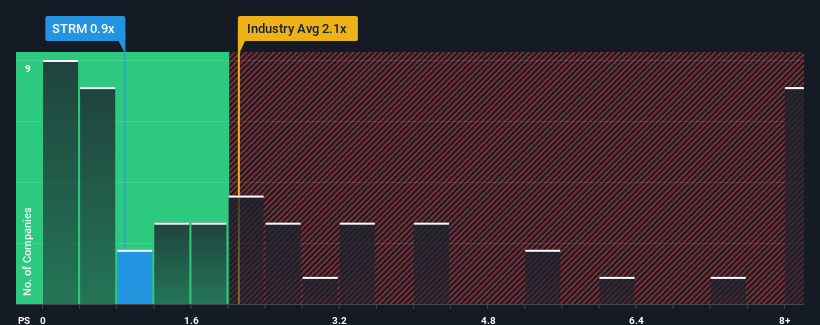
Since its price has dipped substantially, Streamline Health Solutions may be sending bullish signals at the moment with its price-to-sales (or "P/S") ratio of 0.9x, since almost half of all companies in the Healthcare Services industry in the United States have P/S ratios greater than 2.1x and even P/S higher than 5x are not unusual. However, the P/S might be low for a reason and it requires further investigation to determine if it's justified.
See our latest analysis for Streamline Health Solutions
How Has Streamline Health Solutions Performed Recently?
While the industry has experienced revenue growth lately, Streamline Health Solutions' revenue has gone into reverse gear, which is not great. The P/S ratio is probably low because investors think this poor revenue performance isn't going to get any better. So while you could say the stock is cheap, investors will be looking for improvement before they see it as good value.
Keen to find out how analysts think Streamline Health Solutions' future stacks up against the industry? In that case, our free report is a great place to start.Do Revenue Forecasts Match The Low P/S Ratio?
The only time you'd be truly comfortable seeing a P/S as low as Streamline Health Solutions' is when the company's growth is on track to lag the industry.
Taking a look back first, we see that there was hardly any revenue growth to speak of for the company over the past year. However, a few strong years before that means that it was still able to grow revenue by an impressive 117% in total over the last three years. Therefore, it's fair to say the revenue growth recently has been great for the company, but investors will want to ask why it has slowed to such an extent.
Looking ahead now, revenue is anticipated to climb by 4.1% per annum during the coming three years according to the two analysts following the company. Meanwhile, the rest of the industry is forecast to expand by 13% each year, which is noticeably more attractive.
With this in consideration, its clear as to why Streamline Health Solutions' P/S is falling short industry peers. It seems most investors are expecting to see limited future growth and are only willing to pay a reduced amount for the stock.
What Does Streamline Health Solutions' P/S Mean For Investors?
Streamline Health Solutions' recently weak share price has pulled its P/S back below other Healthcare Services companies. Using the price-to-sales ratio alone to determine if you should sell your stock isn't sensible, however it can be a practical guide to the company's future prospects.
As we suspected, our examination of Streamline Health Solutions' analyst forecasts revealed that its inferior revenue outlook is contributing to its low P/S. Right now shareholders are accepting the low P/S as they concede future revenue probably won't provide any pleasant surprises. The company will need a change of fortune to justify the P/S rising higher in the future.
You should always think about risks. Case in point, we've spotted 4 warning signs for Streamline Health Solutions you should be aware of, and 1 of them is significant.
It's important to make sure you look for a great company, not just the first idea you come across. So if growing profitability aligns with your idea of a great company, take a peek at this free list of interesting companies with strong recent earnings growth (and a low P/E).
New: Manage All Your Stock Portfolios in One Place
We've created the ultimate portfolio companion for stock investors, and it's free.
• Connect an unlimited number of Portfolios and see your total in one currency
• Be alerted to new Warning Signs or Risks via email or mobile
• Track the Fair Value of your stocks
Have feedback on this article? Concerned about the content? Get in touch with us directly. Alternatively, email editorial-team (at) simplywallst.com.
This article by Simply Wall St is general in nature. We provide commentary based on historical data and analyst forecasts only using an unbiased methodology and our articles are not intended to be financial advice. It does not constitute a recommendation to buy or sell any stock, and does not take account of your objectives, or your financial situation. We aim to bring you long-term focused analysis driven by fundamental data. Note that our analysis may not factor in the latest price-sensitive company announcements or qualitative material. Simply Wall St has no position in any stocks mentioned.
About NasdaqCM:STRM
Streamline Health Solutions
Provides health information technology solutions and associated services for hospitals and health systems in North America.
Slight risk and slightly overvalued.
Similar Companies
Market Insights

Advertisement
Community Narratives
MINISO's fair value is projected at 26.69 with an anticipated PE ratio shift of 20x
Fair Value US$24.03|11.0% undervalued
BE
Community Contributor
Procter & Gamble: A Dividend Giant Facing Slowing Growth
Fair Value US$119.81|23.3% overvalued
AN
Community Contributor
Eli Lilly's Future Growth Driven by Tirzepatide and Favorable Market Conditions
Fair Value US$1.19k|13.8% undervalued
EA
Community Contributor