- United States
- /
- Medical Equipment
- /
- NasdaqGS:NEOG
Neogen (NASDAQ:NEOG) Takes On Some Risk With Its Use Of Debt

Some say volatility, rather than debt, is the best way to think about risk as an investor, but Warren Buffett famously said that 'Volatility is far from synonymous with risk.' When we think about how risky a company is, we always like to look at its use of debt, since debt overload can lead to ruin. As with many other companies Neogen Corporation (NASDAQ:NEOG) makes use of debt. But the real question is whether this debt is making the company risky.
What Risk Does Debt Bring?
Debt and other liabilities become risky for a business when it cannot easily fulfill those obligations, either with free cash flow or by raising capital at an attractive price. Part and parcel of capitalism is the process of 'creative destruction' where failed businesses are mercilessly liquidated by their bankers. However, a more usual (but still expensive) situation is where a company must dilute shareholders at a cheap share price simply to get debt under control. Of course, the upside of debt is that it often represents cheap capital, especially when it replaces dilution in a company with the ability to reinvest at high rates of return. The first thing to do when considering how much debt a business uses is to look at its cash and debt together.
Check out our latest analysis for Neogen
How Much Debt Does Neogen Carry?
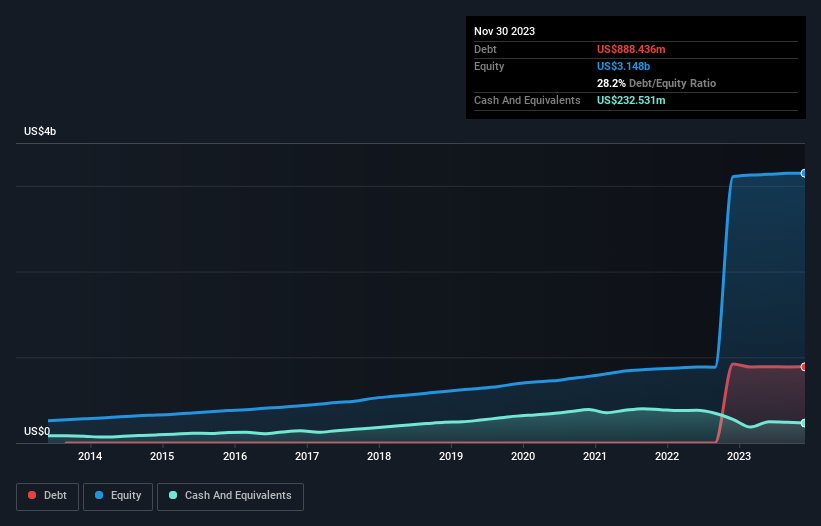
As you can see below, Neogen had US$888.4m of debt, at November 2023, which is about the same as the year before. You can click the chart for greater detail. However, it also had US$232.5m in cash, and so its net debt is US$655.9m.
How Strong Is Neogen's Balance Sheet?
Zooming in on the latest balance sheet data, we can see that Neogen had liabilities of US$176.6m due within 12 months and liabilities of US$1.28b due beyond that. Offsetting this, it had US$232.5m in cash and US$175.8m in receivables that were due within 12 months. So its liabilities total US$1.05b more than the combination of its cash and short-term receivables.
While this might seem like a lot, it is not so bad since Neogen has a market capitalization of US$3.42b, and so it could probably strengthen its balance sheet by raising capital if it needed to. But it's clear that we should definitely closely examine whether it can manage its debt without dilution.
We measure a company's debt load relative to its earnings power by looking at its net debt divided by its earnings before interest, tax, depreciation, and amortization (EBITDA) and by calculating how easily its earnings before interest and tax (EBIT) cover its interest expense (interest cover). The advantage of this approach is that we take into account both the absolute quantum of debt (with net debt to EBITDA) and the actual interest expenses associated with that debt (with its interest cover ratio).
While we wouldn't worry about Neogen's net debt to EBITDA ratio of 3.3, we think its super-low interest cover of 1.3 times is a sign of high leverage. In large part that's due to the company's significant depreciation and amortisation charges, which arguably mean its EBITDA is a very generous measure of earnings, and its debt may be more of a burden than it first appears. So shareholders should probably be aware that interest expenses appear to have really impacted the business lately. More concerning, Neogen saw its EBIT drop by 4.8% in the last twelve months. If it keeps going like that paying off its debt will be like running on a treadmill -- a lot of effort for not much advancement. When analysing debt levels, the balance sheet is the obvious place to start. But it is future earnings, more than anything, that will determine Neogen's ability to maintain a healthy balance sheet going forward. So if you're focused on the future you can check out this free report showing analyst profit forecasts.
Finally, while the tax-man may adore accounting profits, lenders only accept cold hard cash. So the logical step is to look at the proportion of that EBIT that is matched by actual free cash flow. Over the last three years, Neogen reported free cash flow worth 7.8% of its EBIT, which is really quite low. That limp level of cash conversion undermines its ability to manage and pay down debt.
Our View
Mulling over Neogen's attempt at covering its interest expense with its EBIT, we're certainly not enthusiastic. But at least its level of total liabilities is not so bad. It's also worth noting that Neogen is in the Medical Equipment industry, which is often considered to be quite defensive. Once we consider all the factors above, together, it seems to us that Neogen's debt is making it a bit risky. That's not necessarily a bad thing, but we'd generally feel more comfortable with less leverage. When analysing debt levels, the balance sheet is the obvious place to start. But ultimately, every company can contain risks that exist outside of the balance sheet. We've identified 1 warning sign with Neogen , and understanding them should be part of your investment process.
At the end of the day, it's often better to focus on companies that are free from net debt. You can access our special list of such companies (all with a track record of profit growth). It's free.
The New Payments ETF Is Live on NASDAQ:
Money is moving to real-time rails, and a newly listed ETF now gives investors direct exposure. Fast settlement. Institutional custody. Simple access.
Explore how this launch could reshape portfolios
Sponsored ContentValuation is complex, but we're here to simplify it.
Discover if Neogen might be undervalued or overvalued with our detailed analysis, featuring fair value estimates, potential risks, dividends, insider trades, and its financial condition.
Access Free AnalysisHave feedback on this article? Concerned about the content? Get in touch with us directly. Alternatively, email editorial-team (at) simplywallst.com.
This article by Simply Wall St is general in nature. We provide commentary based on historical data and analyst forecasts only using an unbiased methodology and our articles are not intended to be financial advice. It does not constitute a recommendation to buy or sell any stock, and does not take account of your objectives, or your financial situation. We aim to bring you long-term focused analysis driven by fundamental data. Note that our analysis may not factor in the latest price-sensitive company announcements or qualitative material. Simply Wall St has no position in any stocks mentioned.
About NasdaqGS:NEOG
Neogen
Develops, manufactures, and markets various products and services for food and animal safety in the United States and internationally.
Adequate balance sheet and slightly overvalued.
Similar Companies
Market Insights

Weekly Picks

Early mover in a fast growing industry. Likely to experience share price volatility as they scale


A case for CA$31.80 (undiluted), aka 8,616% upside from CA$0.37 (an 86 bagger!).


Moderation and Stabilisation: HOLD: Fair Price based on a 4-year Cycle is $12.08
Recently Updated Narratives


Title: Market Sentiment Is Dead Wrong — Here's Why PSEC Deserves a Second Look


An amazing opportunity to potentially get a 100 bagger

Amazon: Why the World’s Biggest Platform Still Runs on Invisible Economics
Popular Narratives


Crazy Undervalued 42 Baggers Silver Play (Active & Running Mine)


MicroVision will explode future revenue by 380.37% with a vision towards success


NVDA: Expanding AI Demand Will Drive Major Data Center Investments Through 2026
Trending Discussion
