Advertisement
- United States
- /
- Healthcare Services
- /
- NasdaqGS:CRVL
How Does CorVel’s New Tech Partnership Affect Its 2025 Valuation?

Simply Wall St
Reviewed by Bailey Pemberton
- Curious if CorVel is still a buy at today’s prices? You’re not alone, especially with so much market noise surrounding the company’s true value.
- The stock has experienced noticeable ups and downs lately, with a 2.8% gain this past week but still down 30.9% year to date and 35.5% over the last year. This comes even after a solid 5-year climb of 147%.
- Recent headlines have spotlighted CorVel’s new technology partnerships and continued expansions into digital claims solutions, which have caught investor attention. These developments could signal both new growth opportunities and evolving industry dynamics affecting sentiment.
- Based on our valuation checklist, CorVel receives a 1 out of 6 score for being undervalued. This is not a strong endorsement, but as you’ll see below, that only scratches the surface of how to value a company in today’s market. Stay tuned for a deeper dive into not just the standard approaches, but also a more comprehensive method that ties it all together at the end.
CorVel scores just 1/6 on our valuation checks. See what other red flags we found in the full valuation breakdown.
Approach 1: CorVel Discounted Cash Flow (DCF) Analysis
The Discounted Cash Flow (DCF) model estimates the value of a company by projecting its future cash flows and discounting them back to their present value. This approach aims to answer what CorVel’s business is fundamentally worth today if it continues generating cash at the expected rates.
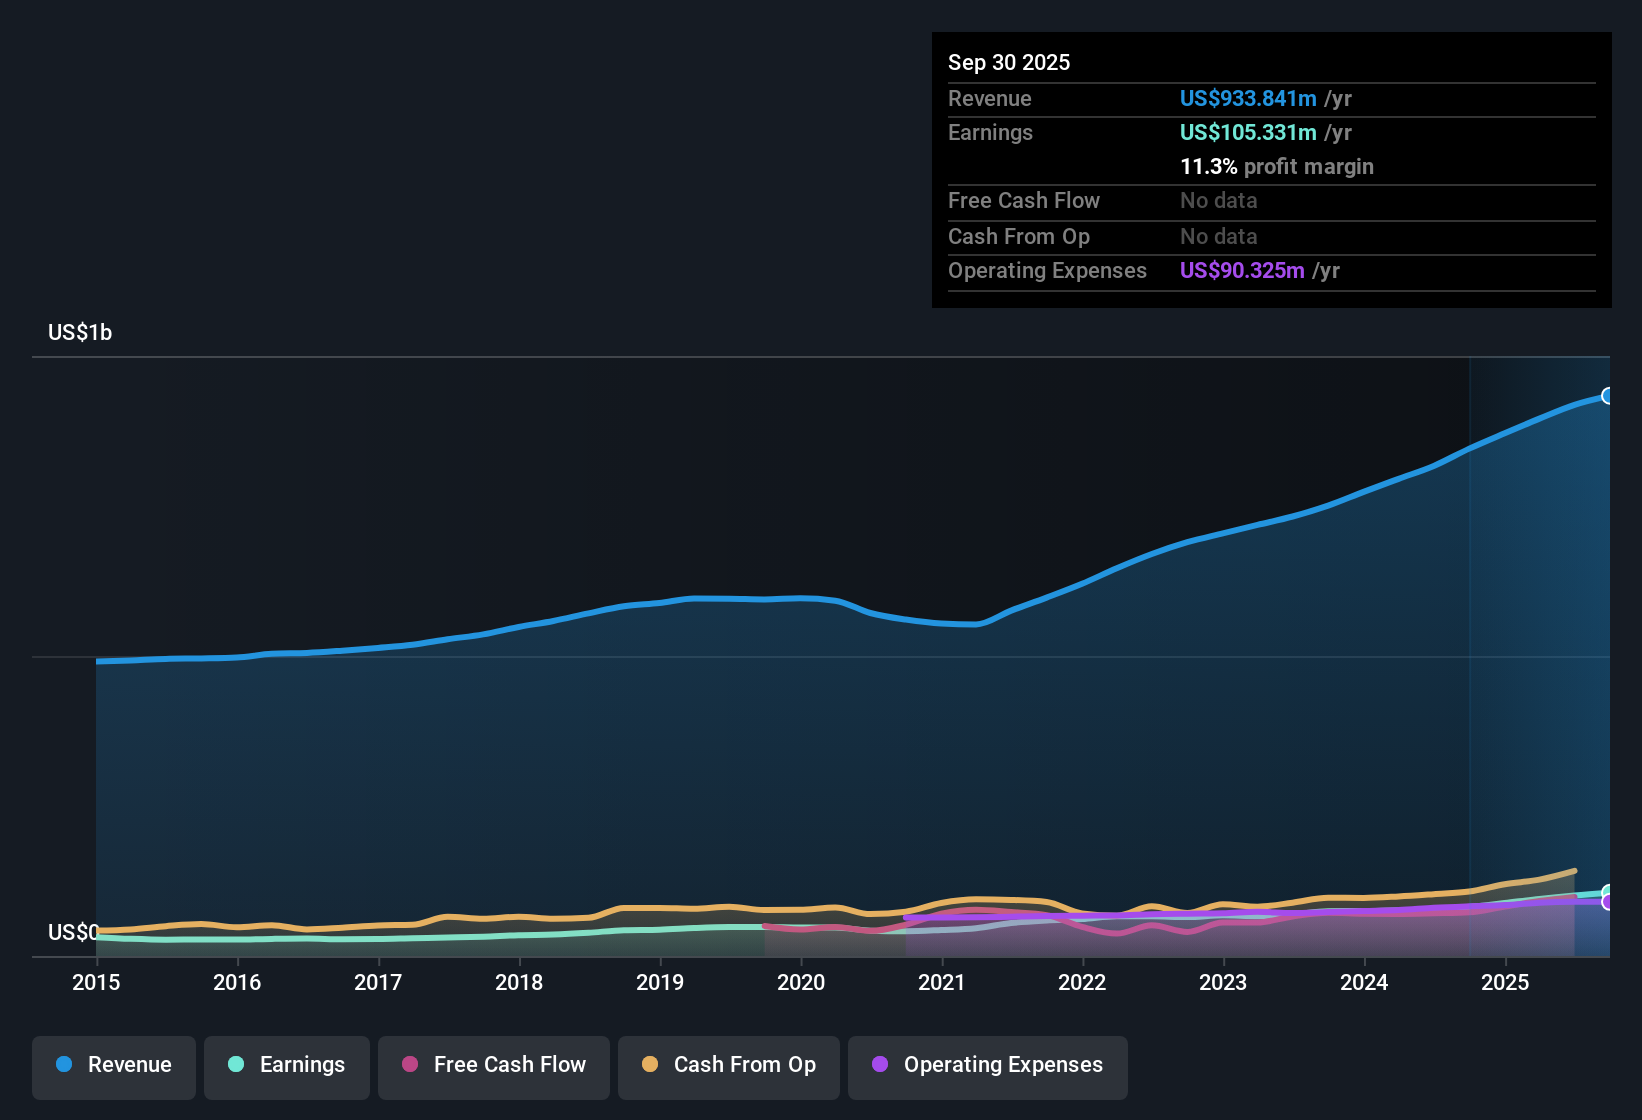
CorVel’s current Free Cash Flow is approximately $106.16 million. Analysts provide forecast data for several years, but projections beyond five years are calculated by Simply Wall St based on expected long-term trends. According to these estimates, CorVel’s free cash flow is expected to gradually grow at rates between about 3% and 4.5% per year, reaching an extrapolated $150.45 million in 2035. All projections are in US dollars.
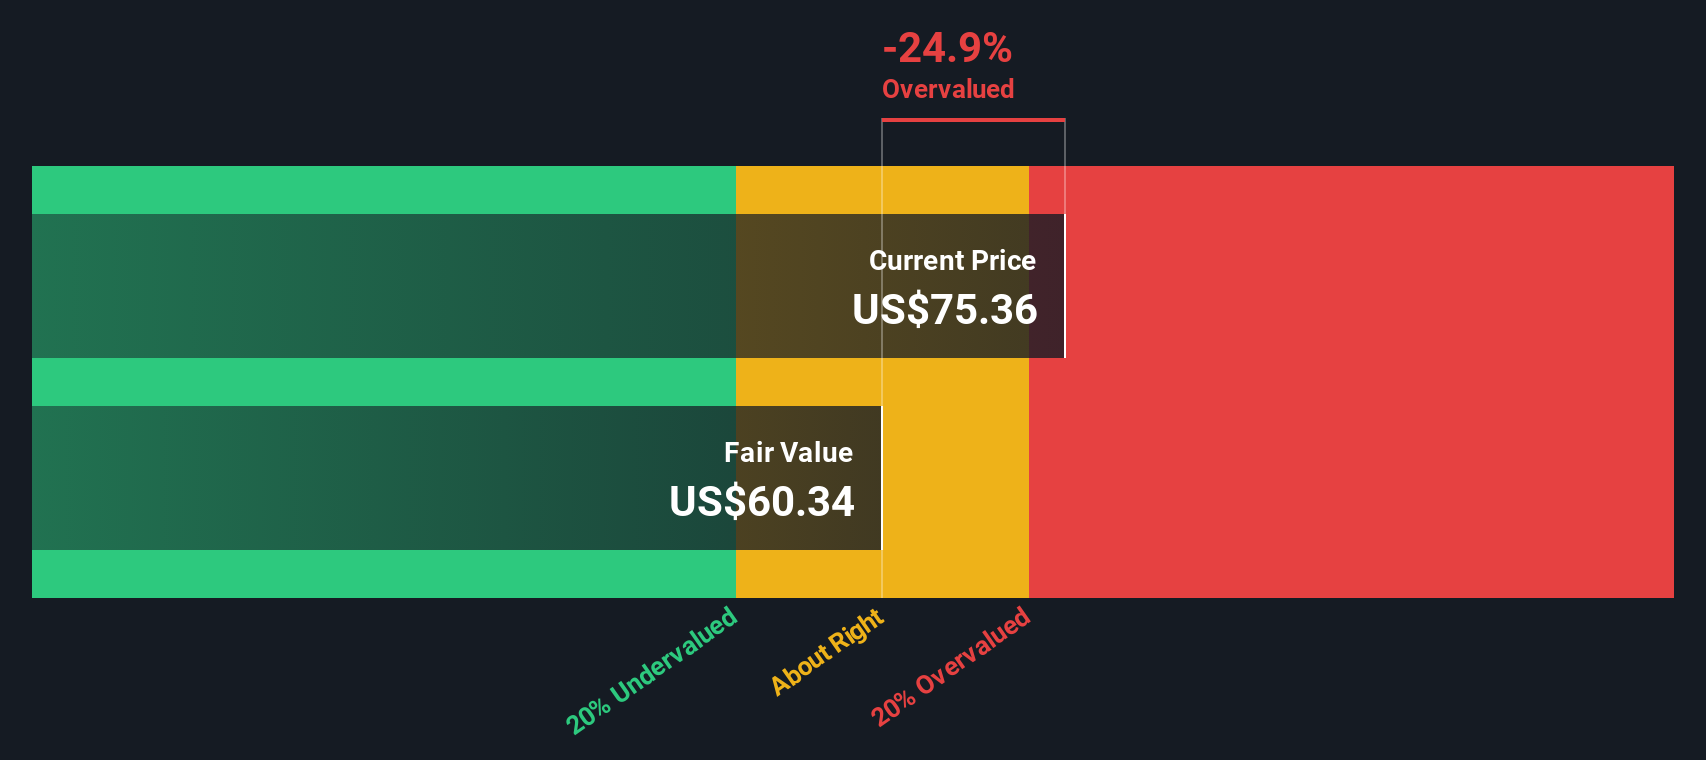
After discounting these future cash flows back to today, the DCF model calculates an intrinsic value of $60.19 per share. Comparing this to CorVel’s current share price suggests that the stock is trading around 25.4% above its estimated fair value. Based on this method, the DCF analysis signals that CorVel is overvalued at today’s prices.
Result: OVERVALUED
Our Discounted Cash Flow (DCF) analysis suggests CorVel may be overvalued by 25.4%. Discover 836 undervalued stocks or create your own screener to find better value opportunities.
Approach 2: CorVel Price vs Earnings
The Price-to-Earnings (PE) ratio is a widely trusted valuation metric for profitable companies like CorVel because it directly links share price to actual earnings. By comparing a company’s price with its per-share earnings, investors can get a sense of how much they are paying for each dollar of profit.
However, what counts as a reasonable or “fair” PE ratio can vary significantly. Companies with higher expected growth or lower risk often justify higher PE ratios, while riskier businesses or those with slower growth typically deserve lower ones. Context is important when interpreting this multiple.
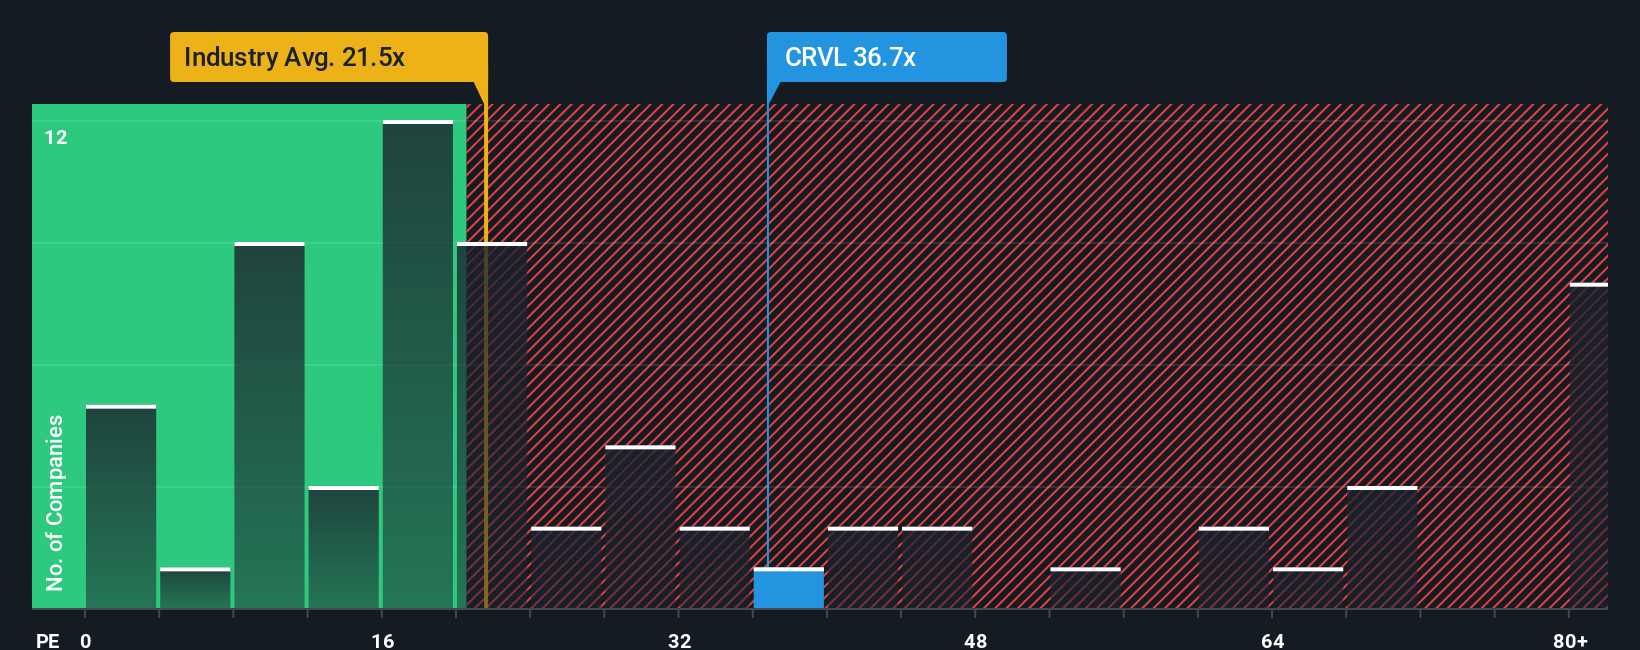
CorVel currently trades at a PE ratio of 36.77x. This is above the Healthcare industry average of 21.51x and just below its peer group average of 43.00x. This suggests that CorVel is priced more optimistically than the typical company in its industry, but slightly more conservatively than some direct peers.
Simply Wall St’s proprietary "Fair Ratio" refines this benchmark by considering not just generic industry norms or the performance of other companies, but also CorVel’s expected growth, profitability, risk profile, and market capitalization. By synthesizing these factors, the Fair Ratio provides a tailored, more meaningful measure of value than simple peer or industry comparisons.
Comparing the Fair Ratio with CorVel’s actual PE suggests the stock is trading at a multiple that is about right given its characteristics and prospects, even if it looks pricier than the broad industry.
Result: ABOUT RIGHT
PE ratios tell one story, but what if the real opportunity lies elsewhere? Discover 1402 companies where insiders are betting big on explosive growth.
Upgrade Your Decision Making: Choose your CorVel Narrative
Earlier we mentioned that there is an even better way to understand valuation, so let us introduce you to Narratives. A Narrative is simply your personal story about a company, your unique view of where it is headed, why, and what numbers back up your opinion. Instead of just crunching numbers, Narratives allow you to link CorVel’s business story with your own financial forecasts and come to a fair value based on your outlook.
With Narratives, anyone can easily connect their beliefs about CorVel’s potential with real forecasts of revenue, earnings, and margins, and then see what that story means for fair value. This powerful tool is available to millions of investors on Simply Wall St’s Community page, giving you an accessible and dynamic way to look beyond generic valuation ratios.
Narratives help you decide when to buy or sell by comparing your calculated Fair Value with the current market Price, and they update automatically as new information like news or earnings releases come in. For example, some investors in the community currently estimate CorVel’s fair value at $50 per share, while others see it as high as $100, reflecting different convictions and interpretations of the same facts.
Do you think there's more to the story for CorVel? Head over to our Community to see what others are saying!
This article by Simply Wall St is general in nature. We provide commentary based on historical data and analyst forecasts only using an unbiased methodology and our articles are not intended to be financial advice. It does not constitute a recommendation to buy or sell any stock, and does not take account of your objectives, or your financial situation. We aim to bring you long-term focused analysis driven by fundamental data. Note that our analysis may not factor in the latest price-sensitive company announcements or qualitative material. Simply Wall St has no position in any stocks mentioned.
New: AI Stock Screener & Alerts
Our new AI Stock Screener scans the market every day to uncover opportunities.
• Dividend Powerhouses (3%+ Yield)
• Undervalued Small Caps with Insider Buying
• High growth Tech and AI Companies
Or build your own from over 50 metrics.
Have feedback on this article? Concerned about the content? Get in touch with us directly. Alternatively, email editorial-team@simplywallst.com
About NasdaqGS:CRVL
CorVel
Provides workers’ compensation, general and auto liability, and hospital bill auditing and payment integrity solutions.
Outstanding track record with flawless balance sheet.
Similar Companies
Market Insights

Advertisement
Community Narratives
The company that turned a verb into a global necessity and basically runs the modern internet, digital ads, smartphones, maps, and AI.
Fair Value US$300.00|5.2% undervalued
OS
Community Contributor
Flowers Foods Pays A Fair Price For Health
Fair Value US$16.12|24.9% undervalued
NV
Community Contributor
TMX Group will thrive with 33.3% profit margin and enduring market moat
Fair Value CA$49.90|3.3% overvalued
LI
Community Contributor
The "Molecular Pencil": Why Beam's Technology is Built to Win
Fair Value US$65.01|64.5% undervalued
DA
Community Contributor