Advertisement
- United States
- /
- Food
- /
- NYSEAM:SEB
Seaboard (SEB): Evaluating Valuation After Major Earnings Turnaround and Profit Recovery

Simply Wall St
Reviewed by Simply Wall St
Seaboard reported a dramatic turnaround this quarter, shifting from a net loss to a $109 million profit, along with higher sales and revenue. Investors also took note of the company’s ongoing dividend and recent strategic investments.
See our latest analysis for Seaboard.
Seaboard’s impressive turnaround has clearly caught the market’s attention, as evident in its 35.4% share price return year-to-date. While the stock pulled back 12.5% over the past month, Seaboard’s 12.4% total shareholder return for the past year reflects a meaningful recovery in sentiment, following a few challenging years.
If Seaboard’s recent momentum has you rethinking your strategy, it could be a perfect time to discover fast growing stocks with high insider ownership.
With the stock rallying sharply on improving fundamentals, the key question now is whether Seaboard is still undervalued after its rebound, or if the recent gains have already taken its growth prospects for the future into account.
Price-to-Earnings of 22.6x: Is it justified?
Seaboard is trading at a price-to-earnings ratio of 22.6x, which places it at a premium versus peers and highlights its valuation following the recent price rally.
The price-to-earnings (P/E) ratio measures how much investors are paying for each dollar of company earnings. For Seaboard, this multiple reflects current profitability and investor sentiment after its earnings turnaround. It is a key metric to assess the cost of buying into future profits rather than current performance alone.
Compared to the US Food industry average P/E of 18.6x, Seaboard is currently considered expensive. Although it is cheaper than its peer average of 31.5x, the company is clearly priced above the broader industry. Investors should be aware that the premium may reflect recent optimism, but it also sets a bar for future earnings growth to justify this valuation.
See what the numbers say about this price — find out in our valuation breakdown.
Result: Price-to-Earnings of 22.6x (OVERVALUED)
However, ongoing volatility in share price and a history of inconsistent longer-term returns could pose challenges to the recent optimism surrounding Seaboard's rebound.
Find out about the key risks to this Seaboard narrative.
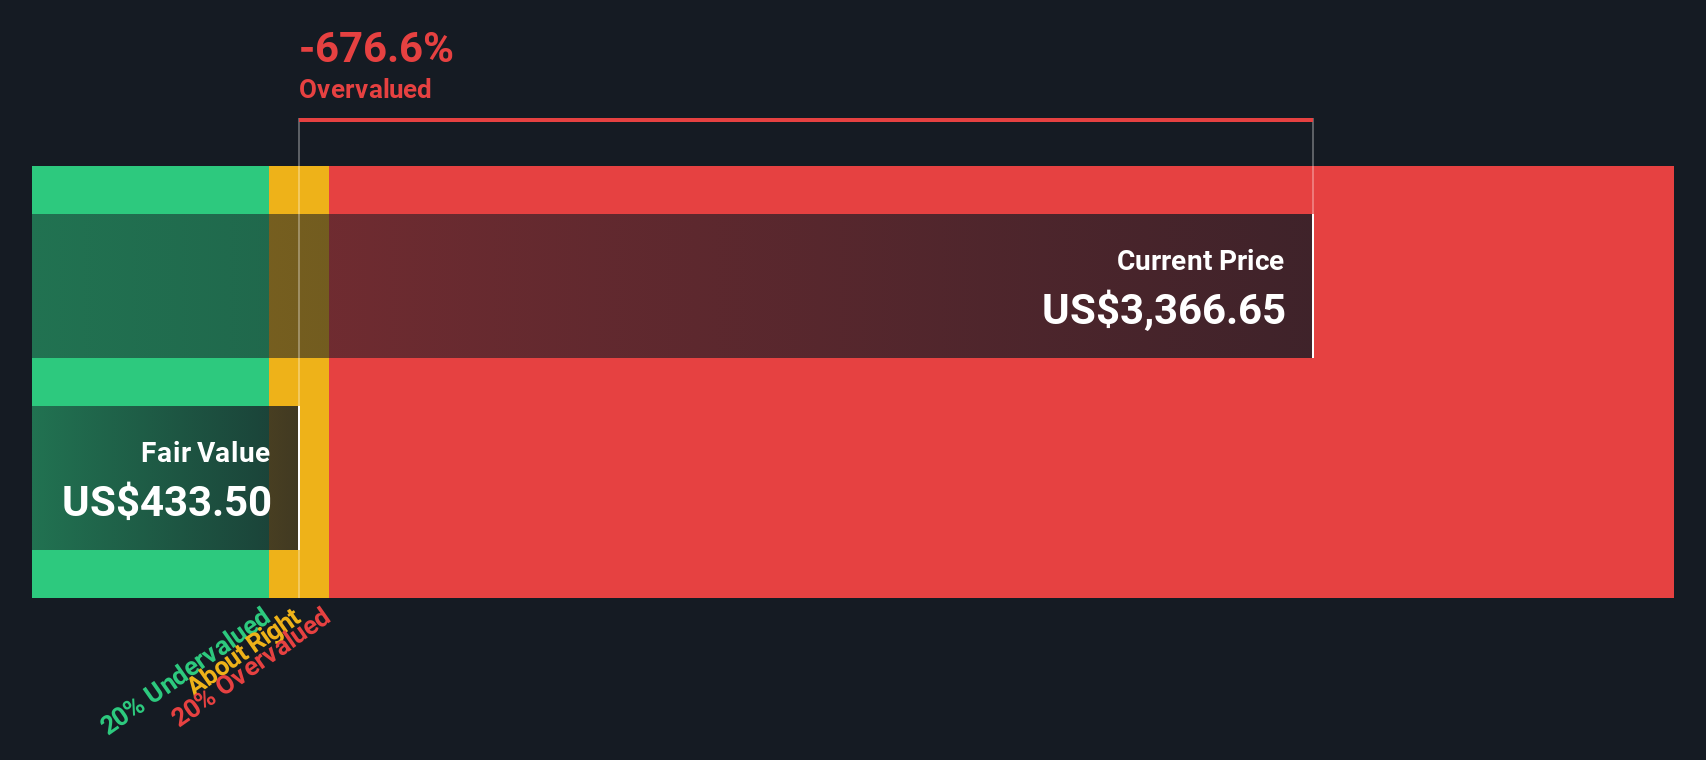
Another View: What Does the SWS DCF Model Say?
Taking a different approach, the SWS DCF model estimates Seaboard’s fair value at $433.5 per share, which is significantly lower than the current price of $3,280. This suggests the stock may be overvalued by a wide margin based on a cash flow perspective. Could Seaboard’s rebound be running ahead of fundamentals, or is there more growth to come?
Look into how the SWS DCF model arrives at its fair value.
Simply Wall St performs a discounted cash flow (DCF) on every stock in the world every day (check out Seaboard for example). We show the entire calculation in full. You can track the result in your watchlist or portfolio and be alerted when this changes, or use our stock screener to discover undervalued stocks based on their cash flows. If you save a screener we even alert you when new companies match - so you never miss a potential opportunity.
Build Your Own Seaboard Narrative
If our assessment doesn’t quite match your outlook, or you favor a hands-on approach, you can shape your own perspective in just a few minutes. Do it your way.
A great starting point for your Seaboard research is our analysis highlighting 2 important warning signs that could impact your investment decision.
Looking for more investment ideas?
Expand your investing horizons and gain an edge by discovering other promising opportunities. Don’t sit on the sidelines while trends shape the next market leaders.
- Grow your portfolio by tapping into steady income streams. Start your search with these 21 dividend stocks with yields > 3% for high-yield opportunities above 3%.
- Catch the next wave of healthcare innovation and harness AI-driven advances through these 34 healthcare AI stocks designed to spotlight this cutting-edge sector.
- Step into the future and see how breakthrough computing technology could transform your investments by evaluating these 28 quantum computing stocks today.
This article by Simply Wall St is general in nature. We provide commentary based on historical data and analyst forecasts only using an unbiased methodology and our articles are not intended to be financial advice. It does not constitute a recommendation to buy or sell any stock, and does not take account of your objectives, or your financial situation. We aim to bring you long-term focused analysis driven by fundamental data. Note that our analysis may not factor in the latest price-sensitive company announcements or qualitative material. Simply Wall St has no position in any stocks mentioned.
New: Manage All Your Stock Portfolios in One Place
We've created the ultimate portfolio companion for stock investors, and it's free.
• Connect an unlimited number of Portfolios and see your total in one currency
• Be alerted to new Warning Signs or Risks via email or mobile
• Track the Fair Value of your stocks
Have feedback on this article? Concerned about the content? Get in touch with us directly. Alternatively, email editorial-team@simplywallst.com
About NYSEAM:SEB
Seaboard
Operates in agricultural, energy, and ocean transportation business worldwide.
Excellent balance sheet with very low risk.
Similar Companies
Market Insights

Advertisement
Community Narratives
The company that turned a verb into a global necessity and basically runs the modern internet, digital ads, smartphones, maps, and AI.
Fair Value US$300.00|10.8% undervalued
OS
Community Contributor
Flowers Foods Pays A Fair Price For Health
Fair Value US$16.12|22.0% undervalued
NV
Community Contributor
TMX Group will thrive with 33.3% profit margin and enduring market moat
Fair Value CA$49.90|3.8% overvalued
LI
Community Contributor