
Advertisement
- United States
- /
- Food
- /
- NYSE:SJM
Read This Before You Buy The J. M. Smucker Company (NYSE:SJM) Because Of Its P/E Ratio

Want to participate in a short research study? Help shape the future of investing tools and receive a $20 prize!
This article is for investors who would like to improve their understanding of price to earnings ratios (P/E ratios). We'll show how you can use The J. M. Smucker Company's (NYSE:SJM) P/E ratio to inform your assessment of the investment opportunity. Based on the last twelve months, J. M. Smucker's P/E ratio is 8.6. That corresponds to an earnings yield of approximately 12%.
Check out our latest analysis for J. M. Smucker
How Do I Calculate J. M. Smucker's Price To Earnings Ratio?
The formula for P/E is:
Price to Earnings Ratio = Price per Share ÷ Earnings per Share (EPS)
Or for J. M. Smucker:
P/E of 8.6 = $101.42 ÷ $11.79 (Based on the year to October 2018.)
Is A High Price-to-Earnings Ratio Good?
A higher P/E ratio implies that investors pay a higher price for the earning power of the business. That isn't a good or a bad thing on its own, but a high P/E means that buyers have a higher opinion of the business's prospects, relative to stocks with a lower P/E.
How Growth Rates Impact P/E Ratios
Earnings growth rates have a big influence on P/E ratios. That's because companies that grow earnings per share quickly will rapidly increase the 'E' in the equation. Therefore, even if you pay a high multiple of earnings now, that multiple will become lower in the future. So while a stock may look expensive based on past earnings, it could be cheap based on future earnings.
Notably, J. M. Smucker grew EPS by a whopping 138% in the last year. And it has bolstered its earnings per share by 19% per year over the last five years. I'd therefore be a little surprised if its P/E ratio was not relatively high.
How Does J. M. Smucker's P/E Ratio Compare To Its Peers?
The P/E ratio essentially measures market expectations of a company. If you look at the image below, you can see J. M. Smucker has a lower P/E than the average (18.7) in the food industry classification.
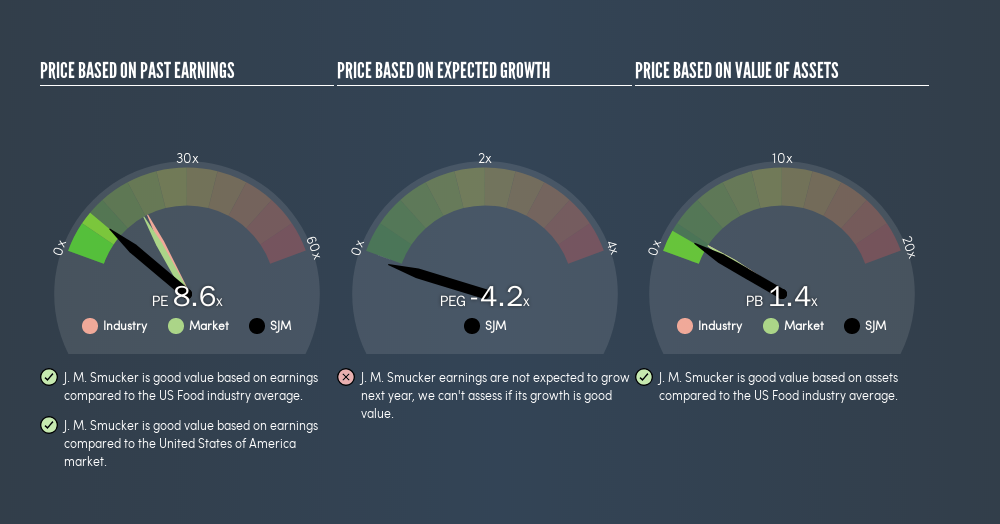
This suggests that market participants think J. M. Smucker will underperform other companies in its industry. While current expectations are low, the stock could be undervalued if the situation is better than the market assumes. It is arguably worth checking if insiders are buying shares, because that might imply they believe the stock is undervalued.
A Limitation: P/E Ratios Ignore Debt and Cash In The Bank
The 'Price' in P/E reflects the market capitalization of the company. That means it doesn't take debt or cash into account. Theoretically, a business can improve its earnings (and produce a lower P/E in the future), by taking on debt (or spending its remaining cash).
Spending on growth might be good or bad a few years later, but the point is that the P/E ratio does not account for the option (or lack thereof).
How Does J. M. Smucker's Debt Impact Its P/E Ratio?
J. M. Smucker's net debt is 53% of its market cap. This is a reasonably significant level of debt -- all else being equal you'd expect a much lower P/E than if it had net cash.
The Verdict On J. M. Smucker's P/E Ratio
J. M. Smucker's P/E is 8.6 which is below average (17.5) in the US market. While the EPS growth last year was strong, the significant debt levels reduce the number of options available to management. The low P/E ratio suggests current market expectations are muted, implying these levels of growth will not continue.
Investors have an opportunity when market expectations about a stock are wrong. If the reality for a company is not as bad as the P/E ratio indicates, then the share price should increase as the market realizes this. So this freevisual report on analyst forecasts could hold the key to an excellent investment decision.
You might be able to find a better buy than J. M. Smucker. If you want a selection of possible winners, check out this freelist of interesting companies that trade on a P/E below 20 (but have proven they can grow earnings).
We aim to bring you long-term focused research analysis driven by fundamental data. Note that our analysis may not factor in the latest price-sensitive company announcements or qualitative material.
If you spot an error that warrants correction, please contact the editor at editorial-team@simplywallst.com. This article by Simply Wall St is general in nature. It does not constitute a recommendation to buy or sell any stock, and does not take account of your objectives, or your financial situation. Simply Wall St has no position in the stocks mentioned. Thank you for reading.
About NYSE:SJM
J. M. Smucker
Manufactures and markets branded food and beverage products worldwide.
Average dividend payer and fair value.
Similar Companies
Market Insights


Advertisement
Community Narratives
A case for TSXV:USA to reach USD $5.00 - $9.00 (CAD $7.30–$12.29) by 2029.
Fair Value CA$12.29|91.2% undervalued
AG
Community Contributor
DLocal's Future Growth Fueled by 35% Revenue and Profit Margin Boosts
Fair Value US$195.39|94.1% undervalued
WY
Community Contributor
Historically Cheap, but the Margin of Safety Is Still Thin
Fair Value SEK 232.58|12.7% undervalued
MA
Community Contributor