Advertisement
- United States
- /
- Food
- /
- NYSE:JBS
JBS (NYSE:JBS): Assessing Valuation as Shares Stabilize After Recent Sector Volatility

Simply Wall St
Reviewed by Simply Wall St
JBS (NYSE:JBS) shares edged higher on light trading volume, with the stock gaining just under 1% at the close. Investors appear focused on recent price action and broader sector shifts as they consider potential next steps for the company.
See our latest analysis for JBS.
After slipping earlier this quarter, JBS’s share price has stabilized. The stock gained 2.2% over the past week and has shown a modest 1.8% 30-day share price return. While it has not fully recovered from its recent 90-day dip, short-term momentum appears to be building as investors react to sector shifts and reassess the company’s growth profile.
If you’re interested in uncovering what’s next in the market beyond food producers, now is an excellent opportunity to broaden your search and discover fast growing stocks with high insider ownership
With recent sector volatility and JBS still trading well below its analyst price target, investors are left to wonder if the current valuation reflects a true bargain or if the market has already priced in all expected growth.
Price-to-Earnings of 6.8x: Is it justified?
With JBS trading at a price-to-earnings (P/E) ratio of just 6.8x, the company appears attractively valued compared to key competitors and broader industry benchmarks. At its last close of $13.26, JBS stands out as potentially overlooked by the market.
The P/E ratio measures how much investors are prepared to pay for each dollar of the company’s earnings. A lower ratio like JBS’s suggests the market may be pricing in low future earnings growth or overlooking recent improvements. For established food producers, this multiple can highlight whether the market has faith in sustained profitability or is discounting recent gains.
Compared to the peer average of 23.7x and the US Food industry average of 17.8x, JBS trades at a significant discount. Such a wide gap may reflect lingering skepticism or could signal an opportunity if recent earnings momentum proves sustainable.
See what the numbers say about this price — find out in our valuation breakdown.
Result: Price-to-Earnings of 6.8x (UNDERVALUED)
However, persistent sector volatility and questions about sustaining recent revenue growth could quickly shift investor sentiment and challenge the current value opportunity.
Find out about the key risks to this JBS narrative.
Another View: Discounted Cash Flow Perspective
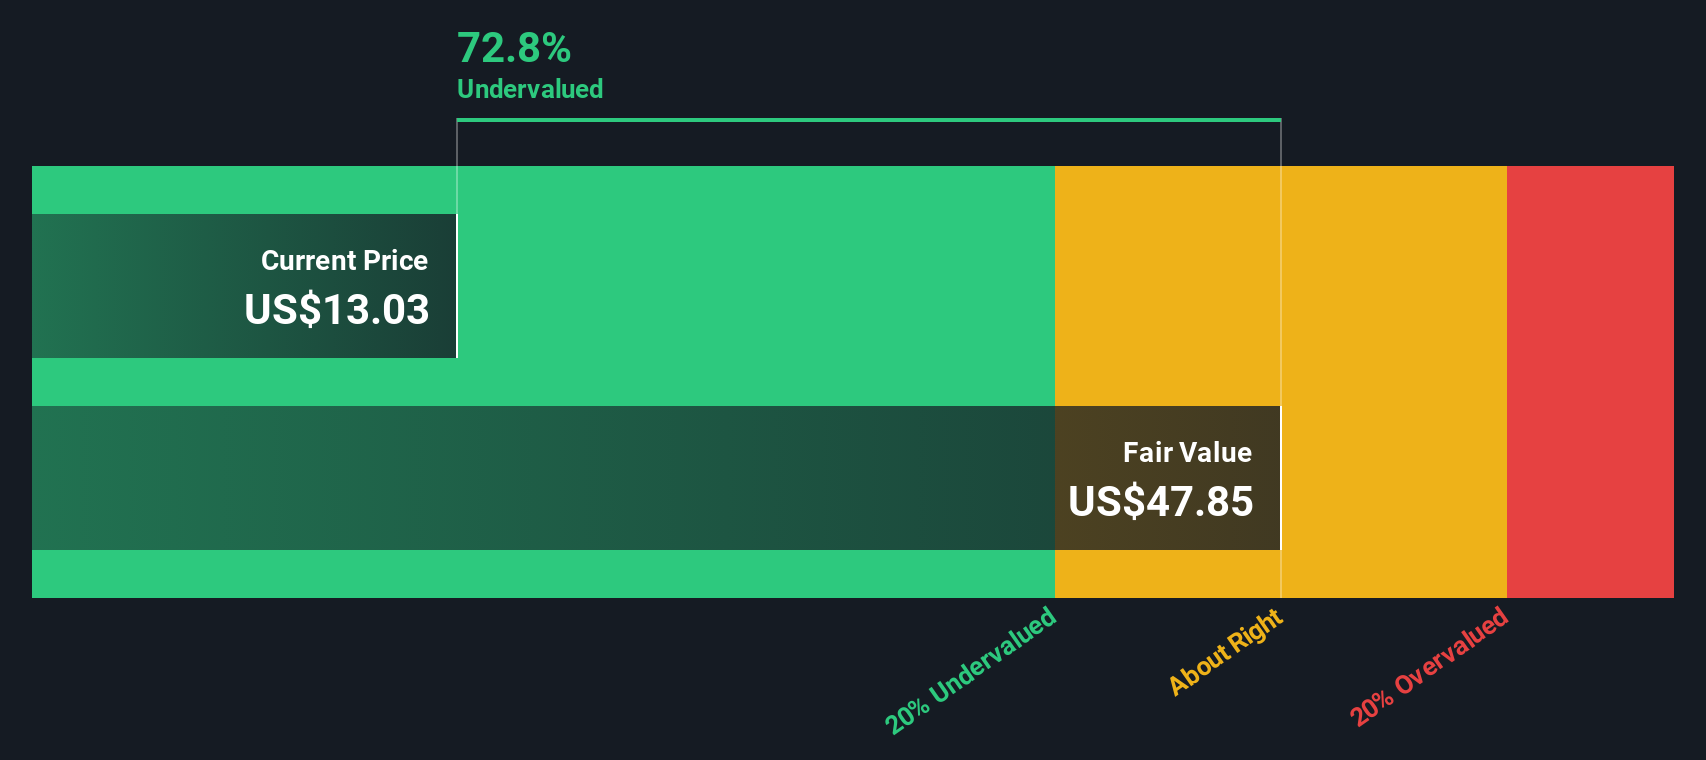
While JBS looks undervalued based on its low price-to-earnings ratio, the SWS DCF model presents an even more dramatic picture. According to this model, JBS’s share price is trading at an 85.4% discount to its estimated fair value. However, it is worth considering whether this calculation could be too optimistic, or if the market is truly overlooking the company's potential.
Look into how the SWS DCF model arrives at its fair value.
Simply Wall St performs a discounted cash flow (DCF) on every stock in the world every day (check out JBS for example). We show the entire calculation in full. You can track the result in your watchlist or portfolio and be alerted when this changes, or use our stock screener to discover 886 undervalued stocks based on their cash flows. If you save a screener we even alert you when new companies match - so you never miss a potential opportunity.
Build Your Own JBS Narrative
If you see things differently or want to dig into the numbers for yourself, you can craft a personalized JBS story in just a few minutes. Do it your way
A great starting point for your JBS research is our analysis highlighting 3 key rewards and 1 important warning sign that could impact your investment decision.
Looking for more investment ideas?
Thousands of investors are staying ahead by acting on unique trends. Don’t limit yourself to just one stock story when you could uncover tomorrow’s standouts with a few clicks.
- Supercharge your portfolio with steady payouts by targeting these 16 dividend stocks with yields > 3% offering yields above 3% and proven income reliability.
- Capitalize on the AI revolution and get in early on these 25 AI penny stocks positioned for high-impact growth as artificial intelligence transforms multiple sectors.
- Go beyond the obvious to spot bargains and access these 886 undervalued stocks based on cash flows, where strong cash flows signal prime opportunities other investors often miss.
This article by Simply Wall St is general in nature. We provide commentary based on historical data and analyst forecasts only using an unbiased methodology and our articles are not intended to be financial advice. It does not constitute a recommendation to buy or sell any stock, and does not take account of your objectives, or your financial situation. We aim to bring you long-term focused analysis driven by fundamental data. Note that our analysis may not factor in the latest price-sensitive company announcements or qualitative material. Simply Wall St has no position in any stocks mentioned.
New: Manage All Your Stock Portfolios in One Place
We've created the ultimate portfolio companion for stock investors, and it's free.
• Connect an unlimited number of Portfolios and see your total in one currency
• Be alerted to new Warning Signs or Risks via email or mobile
• Track the Fair Value of your stocks
Have feedback on this article? Concerned about the content? Get in touch with us directly. Alternatively, email editorial-team@simplywallst.com
About NYSE:JBS
Undervalued with proven track record.
Similar Companies
Market Insights

Advertisement
Community Narratives
MINISO's fair value is projected at 26.69 with an anticipated PE ratio shift of 20x
Fair Value US$24.03|11.0% undervalued
BE
Community Contributor
Procter & Gamble: A Dividend Giant Facing Slowing Growth
Fair Value US$119.81|23.3% overvalued
AN
Community Contributor
Eli Lilly's Future Growth Driven by Tirzepatide and Favorable Market Conditions
Fair Value US$1.19k|13.8% undervalued
EA
Community Contributor