Advertisement
- United States
- /
- Food
- /
- NasdaqGS:CPB
Is Campbell's a Hidden Bargain After a 27% Price Drop in 2025?

Simply Wall St
Reviewed by Bailey Pemberton
- Ever wondered if Campbell's stock is trading at a bargain, or if there's something more beneath the surface that investors keep missing?
- The stock recently slipped by 1.3% over the last week, adding to a nearly -27% decline year-to-date. This has been enough to grab the attention of value hunters and skeptics alike.
- Much of the recent movement followed headlines about shifting consumer preferences and the company's latest product launches, stirring debate about how durable Campbell’s classic brands will be against modern competition. Analysts and investors alike are watching to see if recent innovations can offset changing tastes in the grocery aisle.
- Right now, Campbell's clocks in at a value score of 4 out of 6, which suggests some areas of undervaluation but not a slam dunk across the board. We will explore exactly what goes into this score using multiple valuation perspectives, and reveal an approach at the end that might change how you weigh all the evidence.
Find out why Campbell's's -26.6% return over the last year is lagging behind its peers.
Approach 1: Campbell's Discounted Cash Flow (DCF) Analysis
The Discounted Cash Flow (DCF) approach estimates the intrinsic value of a company by projecting its future cash flows and discounting them back to reflect today's dollars. Essentially, this method answers the question: what are all of Campbell's future cash flows worth if you received them right now?
Currently, Campbell's generates Free Cash Flow (FCF) of $670.7 Million. Analysts have forecast that the company's FCF will grow moderately, reaching around $779 Million by the fiscal year ending July 2028. For years beyond 2028, projections are extrapolated using trends in the industry and Campbell's recent performance.
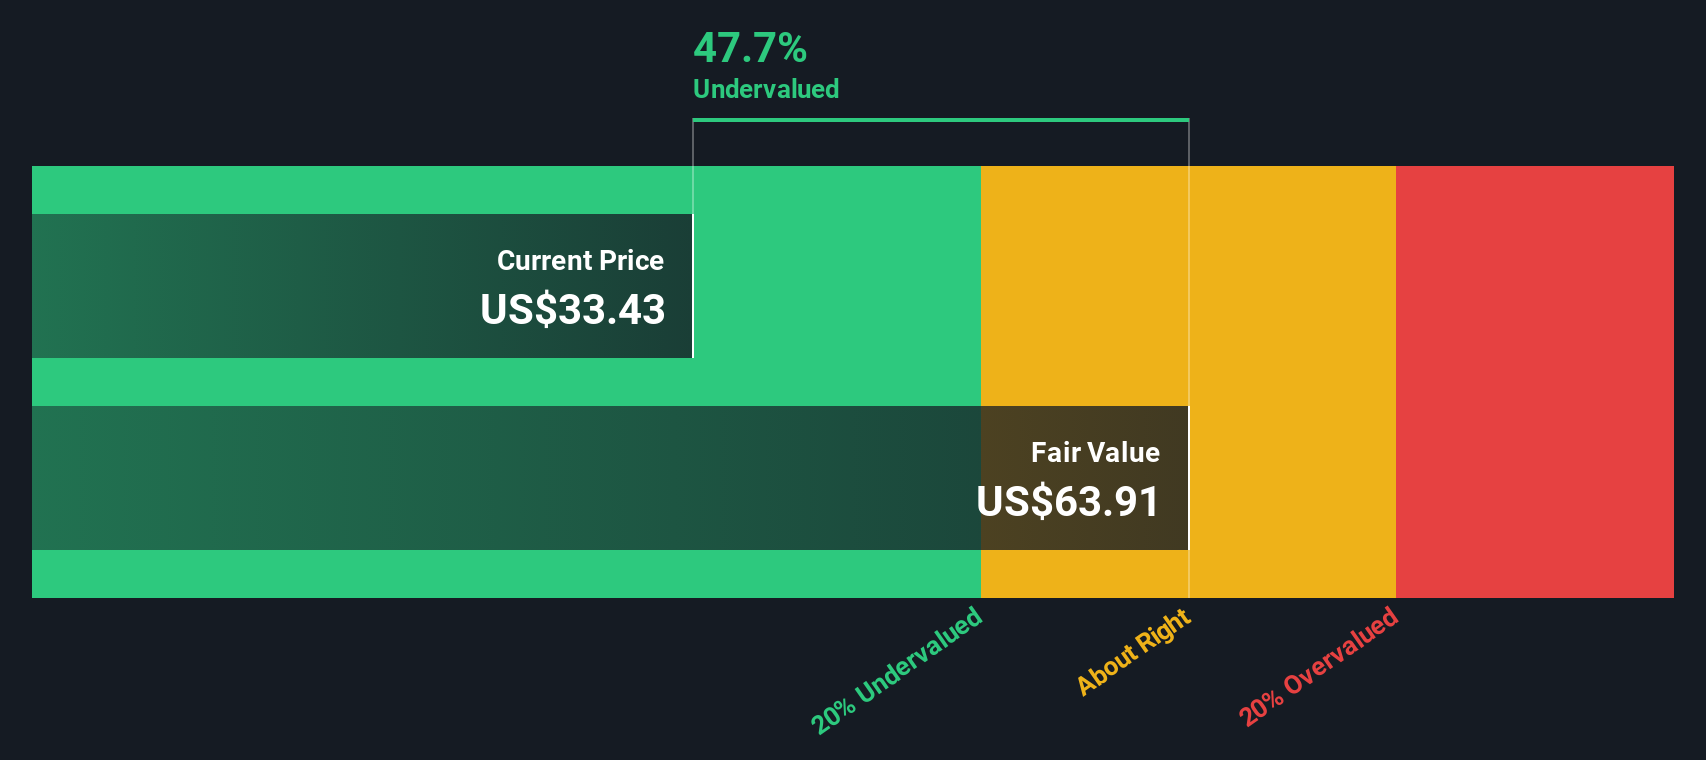
Based on the DCF model, which synthesizes near-term analyst forecasts and longer-term growth assumptions, Campbell's estimated fair value stands at $63.56 per share. The model indicates a 51.6% intrinsic discount compared to the current market price. This analysis strongly suggests that the stock is significantly undervalued at present.
Result: UNDERVALUED
Our Discounted Cash Flow (DCF) analysis suggests Campbell's is undervalued by 51.6%. Track this in your watchlist or portfolio, or discover 897 more undervalued stocks based on cash flows.
Approach 2: Campbell's Price vs Earnings
For profitable companies like Campbell's, the Price-to-Earnings (PE) ratio is a popular and meaningful way to gauge value. This metric tells investors how much they are paying for each dollar of the company’s earnings, providing a quick snapshot of the market’s expectations for future profitability.
It is important to keep in mind that the “right” PE ratio depends on factors like the company's growth prospects, profitability, and risk profile. A higher PE may be justified if investors believe growth will accelerate. More uncertain outlooks or lower growth usually translate into a lower PE.
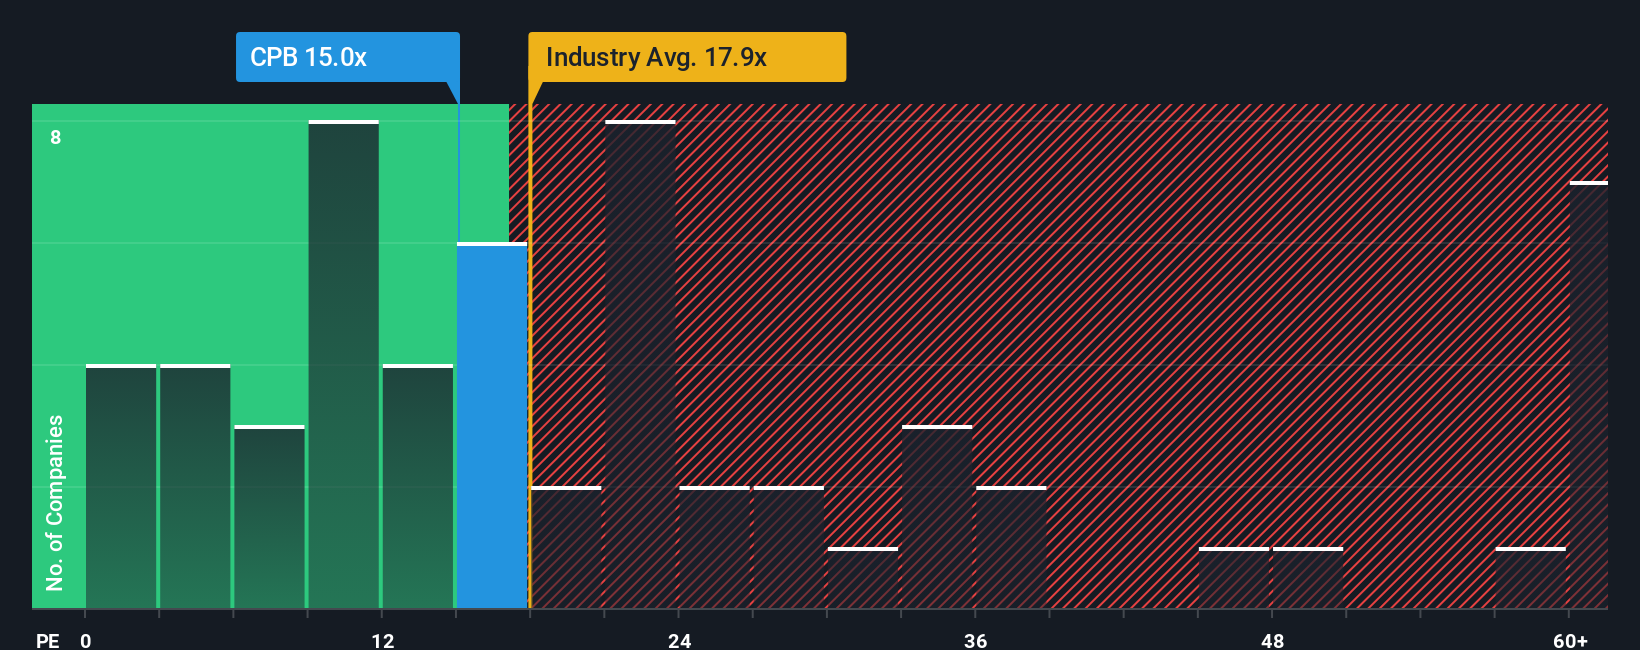
Currently, Campbell's trades at a PE ratio of 15.2x, which is above its peer average of 13.3x but still below the broader food industry average of 19.2x. While these benchmarks provide context, Simply Wall St’s Fair Ratio goes further. For Campbell's, the Fair Ratio is calculated at 17.9x. This proprietary figure considers a much wider range of variables, including the company’s earnings growth, industry conditions, profit margins, market cap, and overall risk exposure. In short, it gives a more tailored and holistic sense of what a “reasonable” multiple should be for Campbell's at this point in time.
Comparing Campbell’s actual PE of 15.2x to its Fair Ratio of 17.9x reveals some potential undervaluation, suggesting the stock may not be fully priced for its fundamental strengths and future prospects.
Result: UNDERVALUED
PE ratios tell one story, but what if the real opportunity lies elsewhere? Discover 1416 companies where insiders are betting big on explosive growth.
Upgrade Your Decision Making: Choose your Campbell's Narrative
Earlier we mentioned that there's an even better way to understand valuation, so let's introduce you to Narratives. This is an easy, dynamic approach used by millions on Simply Wall St’s Community page.
A Narrative is your personal story and perspective behind a company’s numbers. It connects what you believe about Campbell’s future (such as revenue, margins, new products, or market risks) to financial forecasts and, ultimately, to a fair value for the stock.
With Narratives, you can turn your view of the business—whether you are optimistic about cost savings and innovation driving growth or concerned about challenges in processed foods—into real numbers and see how this story translates into valuation.
This tool lets you compare your assumed fair value to the current market price. It helps you decide if it’s time to buy, sell, or wait. Narratives update automatically as new news or earnings results come in, refining your viewpoint.
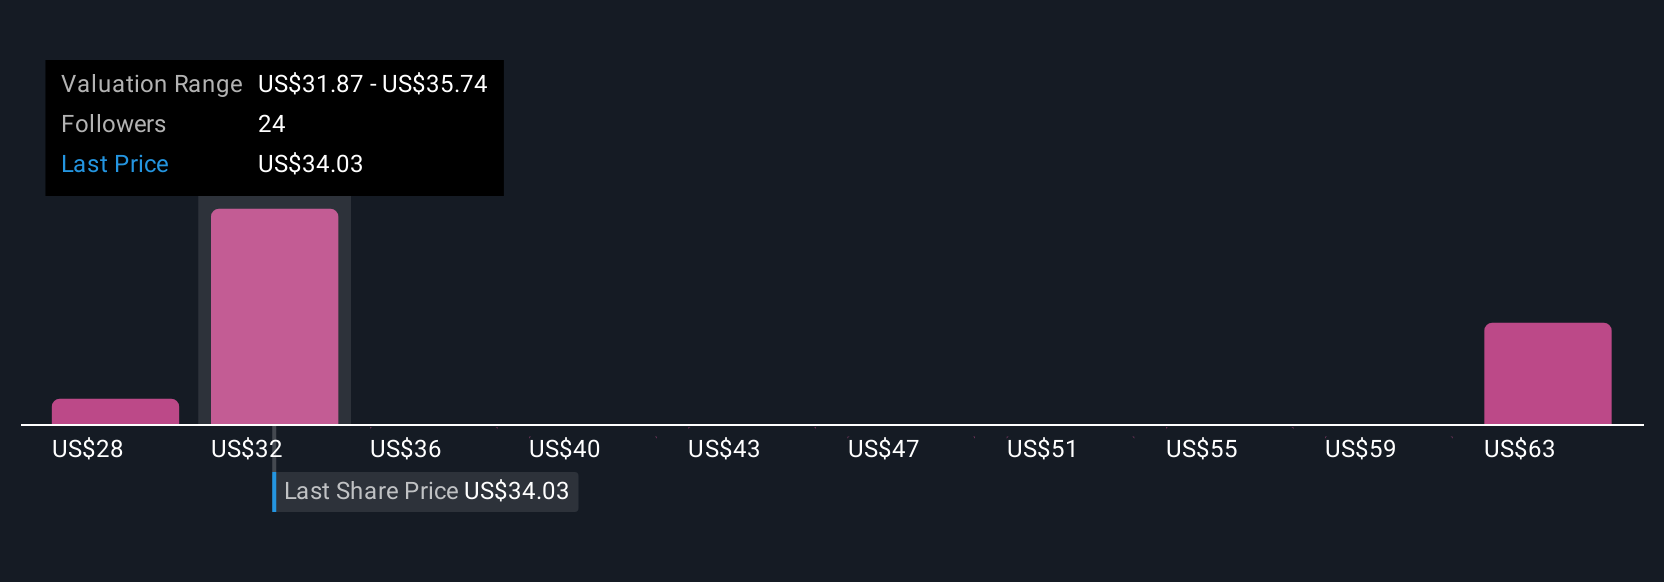
For example, one investor might create a Narrative expecting Campbell’s earnings to surge toward $1.2 billion and price the stock near $62. Another investor, focused on risks like cost pressure and slowing demand, may see fair value as low as $29. This demonstrates just how powerfully perspectives can shape investment decisions.
Do you think there's more to the story for Campbell's? Head over to our Community to see what others are saying!
This article by Simply Wall St is general in nature. We provide commentary based on historical data and analyst forecasts only using an unbiased methodology and our articles are not intended to be financial advice. It does not constitute a recommendation to buy or sell any stock, and does not take account of your objectives, or your financial situation. We aim to bring you long-term focused analysis driven by fundamental data. Note that our analysis may not factor in the latest price-sensitive company announcements or qualitative material. Simply Wall St has no position in any stocks mentioned.
New: AI Stock Screener & Alerts
Our new AI Stock Screener scans the market every day to uncover opportunities.
• Dividend Powerhouses (3%+ Yield)
• Undervalued Small Caps with Insider Buying
• High growth Tech and AI Companies
Or build your own from over 50 metrics.
Have feedback on this article? Concerned about the content? Get in touch with us directly. Alternatively, email editorial-team@simplywallst.com
About NasdaqGS:CPB
Campbell's
Manufactures and markets food and beverage products in the United States and internationally.
6 star dividend payer and good value.
Similar Companies
Market Insights

Advertisement
Community Narratives
MicroVision will explode future revenue by 380.37% with a vision towards success
Fair Value US$60.00|98.4% undervalued
TH
Community Contributor
The Indispensable Artery for a New North American Economy
Fair Value CA$132.87|1.3% undervalued
TI
Community Contributor