
Advertisement
- United States
- /
- Oil and Gas
- /
- NYSE:TEN
Would Shareholders Who Purchased Tsakos Energy Navigation's (NYSE:TNP) Stock Five Years Be Happy With The Share price Today?
Statistically speaking, long term investing is a profitable endeavour. But unfortunately, some companies simply don't succeed. To wit, the Tsakos Energy Navigation Limited (NYSE:TNP) share price managed to fall 68% over five long years. That is extremely sub-optimal, to say the least. And we doubt long term believers are the only worried holders, since the stock price has declined 34% over the last twelve months. It's up 1.6% in the last seven days.
Check out our latest analysis for Tsakos Energy Navigation
Because Tsakos Energy Navigation made a loss in the last twelve months, we think the market is probably more focussed on revenue and revenue growth, at least for now. When a company doesn't make profits, we'd generally expect to see good revenue growth. As you can imagine, fast revenue growth, when maintained, often leads to fast profit growth.
Over five years, Tsakos Energy Navigation grew its revenue at 4.9% per year. That's not a very high growth rate considering it doesn't make profits. It's likely this weak growth has contributed to an annualised return of 11% for the last five years. We want to see an acceleration of revenue growth (or profits) before showing much interest in this one. When a stock falls hard like this, some investors like to add the company to a watchlist (in case the business recovers, longer term).
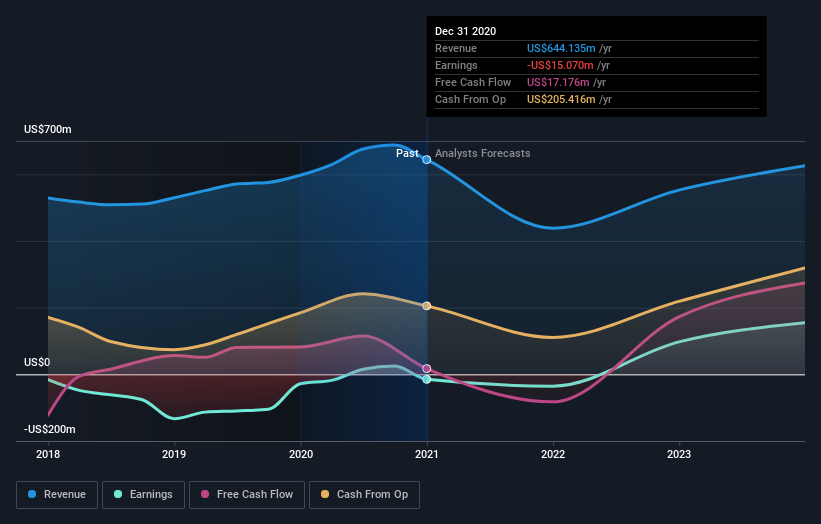
The image below shows how earnings and revenue have tracked over time (if you click on the image you can see greater detail).
You can see how its balance sheet has strengthened (or weakened) over time in this free interactive graphic.
What About Dividends?
As well as measuring the share price return, investors should also consider the total shareholder return (TSR). Whereas the share price return only reflects the change in the share price, the TSR includes the value of dividends (assuming they were reinvested) and the benefit of any discounted capital raising or spin-off. Arguably, the TSR gives a more comprehensive picture of the return generated by a stock. In the case of Tsakos Energy Navigation, it has a TSR of -61% for the last 5 years. That exceeds its share price return that we previously mentioned. And there's no prize for guessing that the dividend payments largely explain the divergence!
A Different Perspective
Tsakos Energy Navigation shareholders are down 31% for the year (even including dividends), but the market itself is up 53%. However, keep in mind that even the best stocks will sometimes underperform the market over a twelve month period. Regrettably, last year's performance caps off a bad run, with the shareholders facing a total loss of 10% per year over five years. Generally speaking long term share price weakness can be a bad sign, though contrarian investors might want to research the stock in hope of a turnaround. It's always interesting to track share price performance over the longer term. But to understand Tsakos Energy Navigation better, we need to consider many other factors. To that end, you should learn about the 2 warning signs we've spotted with Tsakos Energy Navigation (including 1 which is a bit unpleasant) .
If you like to buy stocks alongside management, then you might just love this free list of companies. (Hint: insiders have been buying them).
Please note, the market returns quoted in this article reflect the market weighted average returns of stocks that currently trade on US exchanges.
When trading Tsakos Energy Navigation or any other investment, use the platform considered by many to be the Professional's Gateway to the Worlds Market, Interactive Brokers. You get the lowest-cost* trading on stocks, options, futures, forex, bonds and funds worldwide from a single integrated account. Promoted
Valuation is complex, but we're here to simplify it.
Discover if Tsakos Energy Navigation might be undervalued or overvalued with our detailed analysis, featuring fair value estimates, potential risks, dividends, insider trades, and its financial condition.
Access Free AnalysisThis article by Simply Wall St is general in nature. It does not constitute a recommendation to buy or sell any stock, and does not take account of your objectives, or your financial situation. We aim to bring you long-term focused analysis driven by fundamental data. Note that our analysis may not factor in the latest price-sensitive company announcements or qualitative material. Simply Wall St has no position in any stocks mentioned.
*Interactive Brokers Rated Lowest Cost Broker by StockBrokers.com Annual Online Review 2020
Have feedback on this article? Concerned about the content? Get in touch with us directly. Alternatively, email editorial-team (at) simplywallst.com.
About NYSE:TEN
Tsakos Energy Navigation
Provides seaborne crude oil and petroleum product transportation services worldwide.
Undervalued average dividend payer.
Similar Companies
Market Insights

Advertisement
Community Narratives
The company that turned a verb into a global necessity and basically runs the modern internet, digital ads, smartphones, maps, and AI.
Fair Value US$300.00|5.2% undervalued
OS
Community Contributor
Flowers Foods Pays A Fair Price For Health
Fair Value US$16.12|24.9% undervalued
NV
Community Contributor
TMX Group will thrive with 33.3% profit margin and enduring market moat
Fair Value CA$49.90|3.3% overvalued
LI
Community Contributor
The "Molecular Pencil": Why Beam's Technology is Built to Win
Fair Value US$65.01|64.5% undervalued
DA
Community Contributor