Stock Analysis
- United States
- /
- Oil and Gas
- /
- NYSE:NOG
Those who invested in Northern Oil and Gas (NYSE:NOG) three years ago are up 277%

The most you can lose on any stock (assuming you don't use leverage) is 100% of your money. But when you pick a company that is really flourishing, you can make more than 100%. For instance the Northern Oil and Gas, Inc. (NYSE:NOG) share price is 244% higher than it was three years ago. Most would be happy with that. Also pleasing for shareholders was the 25% gain in the last three months.
So let's investigate and see if the longer term performance of the company has been in line with the underlying business' progress.
Check out our latest analysis for Northern Oil and Gas
To quote Buffett, 'Ships will sail around the world but the Flat Earth Society will flourish. There will continue to be wide discrepancies between price and value in the marketplace...' By comparing earnings per share (EPS) and share price changes over time, we can get a feel for how investor attitudes to a company have morphed over time.
During three years of share price growth, Northern Oil and Gas moved from a loss to profitability. Given the importance of this milestone, it's not overly surprising that the share price has increased strongly.
The image below shows how EPS has tracked over time (if you click on the image you can see greater detail).
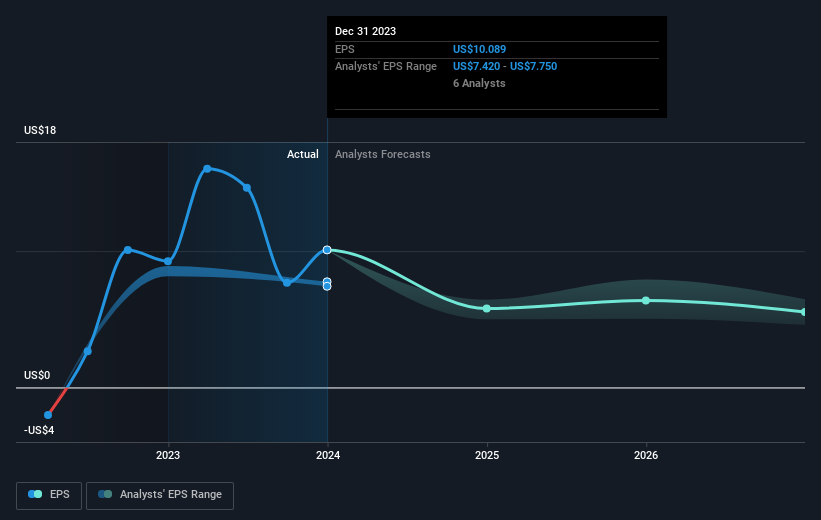
It is of course excellent to see how Northern Oil and Gas has grown profits over the years, but the future is more important for shareholders. You can see how its balance sheet has strengthened (or weakened) over time in this free interactive graphic.
What About Dividends?
It is important to consider the total shareholder return, as well as the share price return, for any given stock. Whereas the share price return only reflects the change in the share price, the TSR includes the value of dividends (assuming they were reinvested) and the benefit of any discounted capital raising or spin-off. Arguably, the TSR gives a more comprehensive picture of the return generated by a stock. As it happens, Northern Oil and Gas' TSR for the last 3 years was 277%, which exceeds the share price return mentioned earlier. And there's no prize for guessing that the dividend payments largely explain the divergence!
A Different Perspective
We're pleased to report that Northern Oil and Gas shareholders have received a total shareholder return of 33% over one year. That's including the dividend. That's better than the annualised return of 10% over half a decade, implying that the company is doing better recently. Someone with an optimistic perspective could view the recent improvement in TSR as indicating that the business itself is getting better with time. It's always interesting to track share price performance over the longer term. But to understand Northern Oil and Gas better, we need to consider many other factors. For example, we've discovered 5 warning signs for Northern Oil and Gas (2 are concerning!) that you should be aware of before investing here.
If you would prefer to check out another company -- one with potentially superior financials -- then do not miss this free list of companies that have proven they can grow earnings.
Please note, the market returns quoted in this article reflect the market weighted average returns of stocks that currently trade on American exchanges.
Valuation is complex, but we're helping make it simple.
Find out whether Northern Oil and Gas is potentially over or undervalued by checking out our comprehensive analysis, which includes fair value estimates, risks and warnings, dividends, insider transactions and financial health.
View the Free AnalysisHave feedback on this article? Concerned about the content? Get in touch with us directly. Alternatively, email editorial-team (at) simplywallst.com.
This article by Simply Wall St is general in nature. We provide commentary based on historical data and analyst forecasts only using an unbiased methodology and our articles are not intended to be financial advice. It does not constitute a recommendation to buy or sell any stock, and does not take account of your objectives, or your financial situation. We aim to bring you long-term focused analysis driven by fundamental data. Note that our analysis may not factor in the latest price-sensitive company announcements or qualitative material. Simply Wall St has no position in any stocks mentioned.
About NYSE:NOG
Northern Oil and Gas
Northern Oil and Gas, Inc., an independent energy company, engages in the acquisition, exploration, exploitation, development, and production of crude oil and natural gas properties in the United States.
Very undervalued with acceptable track record.
